Calcific aortic valve disease (CAVD) is a progressive cardiovascular disorder affecting over 12.6 million people worldwide, yet it remains undetected until advanced stages when observable changes in hydrodynamics emerge. This dissertation proposes and validates hemodynamic wall metrics — time-averaged wall shear stress (TAWSS) and oscillatory shear index (OSI) — as pre-symptomatic biomarkers of CAVD, detectable through computational fluid-structure interaction (FSI) simulations before conventional hydrodynamic parameters show any sign of disease.
Calcific aortic valve disease (CAVD) is a highly debilitating and progressive cardiovascular disorder that results in gradual narrowing of the aortic outflow tract and reduces the heart's ability to supply the body with oxygenated blood. CAVD affects over 12.6 million people worldwide as of 2017 and its prevalence is expected to double within the next 50 years due to population growth and aging. There is currently no known treatment beyond valve replacement, and no animal model that can entirely replicate the complexities seen in human pathologies to allow reliable testing of proposed therapeutics.
CAVD begins as an asymptomatic aortic valve sclerosis and therefore does not produce significant changes in conventional hydrodynamic parameters — regurgitation fraction (RF), effective orifice area (EOA), mean flow rate (Qrms), or pressure gradient (ΔP) — to levels associated with even mild CAVD. This makes early detection by standard clinical measures impossible. In terms of hemodynamics, long-term exposure to abnormal wall shear stress (WSS) is known to cause adverse endothelial cell remodeling. Specifically, low TAWSS (<4 dynes/cm²) correlates with atherosclerotic development in vasculature — morphologically analogous to CAVD. There is also evidence of extremely high WSS on the tips of calcified leaflets, with WSS differences between the fibrosa and ventricularis increasing under CAVD. The oscillatory shear index (OSI), a measure of flow pulsatility, coincides with early plaque formation in arteries when high (>0.3).
Prior CFD studies showed that OSI values of 0.18–0.23 within certain WSS magnitudes contribute to healthy valve tissue formation, while high OSI (~0.5) led to increased valve interstitial cell calcification. This indicates the critical importance of fluid dynamics in understanding valve disease states.
Central Hypothesis: Even a very mildly calcified aortic valve — one that shows no apparent hydrodynamic abnormality (normal ΔP, EOA, RF, Qrms) — should have identifiable CFD-derived biomarkers (TAWSS and OSI) that are markedly different from a healthy, uncalcified valve. These biomarkers could serve as a predictive tool for early-stage, pre-symptomatic CAVD detection.
Specific Aims
Aim 1 — Viscosity Model Validity
Confirm whether a Newtonian viscosity model is valid for severely calcified aortic valve geometries. Test multiple non-Newtonian viscosity models against their Newtonian counterpart to determine differences in hemodynamic outcomes (WSS, OSI, shear rate) and identify which model is most applicable for CAVD geometries.
Aim 2 — Early-Stage Biomarkers
Investigate hydrodynamic (ΔP, RF, Qrms, EOA) and hemodynamic (OSI, TAWSS) parameters in very mildly calcified PSIS bioscaffold valves across three groups: raw/healthy, statically conditioned in calcific media, and bioreactor-conditioned in calcific media. Determine how these parameters vary and whether hemodynamic metrics can detect disease when hydrodynamics cannot.
Aim 3 — Parametric Pipeline
Investigate the applicability of the computational model on computationally generated calcified aortic valve geometries of varying severity (none, mild, medium, severe) across clinical valve sizes (22–30 mm). Run N=20 two-way FSI simulations to determine whether hemodynamic biomarkers (TAWSS, OSI) can delineate CAVD intensity and progression.
CH. 2–3
Biological & Engineering Background
Context
The aortic valve (AV) is a tri-leaflet structure separating the left ventricle from the aortic outflow tract. Each leaflet comprises three ECM layers — the ventricularis (elastin-rich, flow-facing), spongiosa (proteoglycan-rich core), and fibrosa (collagen-rich, pressure-bearing) — each serving distinct mechanical roles. Calcific aortic valve disease (CAVD) begins as asymptomatic aortic valve sclerosis: calcific nodules form primarily along the coaptation lines and spread toward the leaflet belly, progressively restricting leaflet motion and narrowing the outflow tract (aortic stenosis, AS).
CAVD affects 12.6 million people globally (2017) and prevalence is expected to double over the next 50 years. No pharmacological treatment exists — the only definitive therapy is surgical aortic valve replacement (SAVR) or, increasingly, transcatheter AV replacement (TAVR). TAVR has surpassed SAVR as the preferred approach since it is minimally invasive, requires no cardiopulmonary bypass, and patients are often discharged the same day. However, both approaches intervene only after disease has progressed to a symptomatic, surgically operable stage.
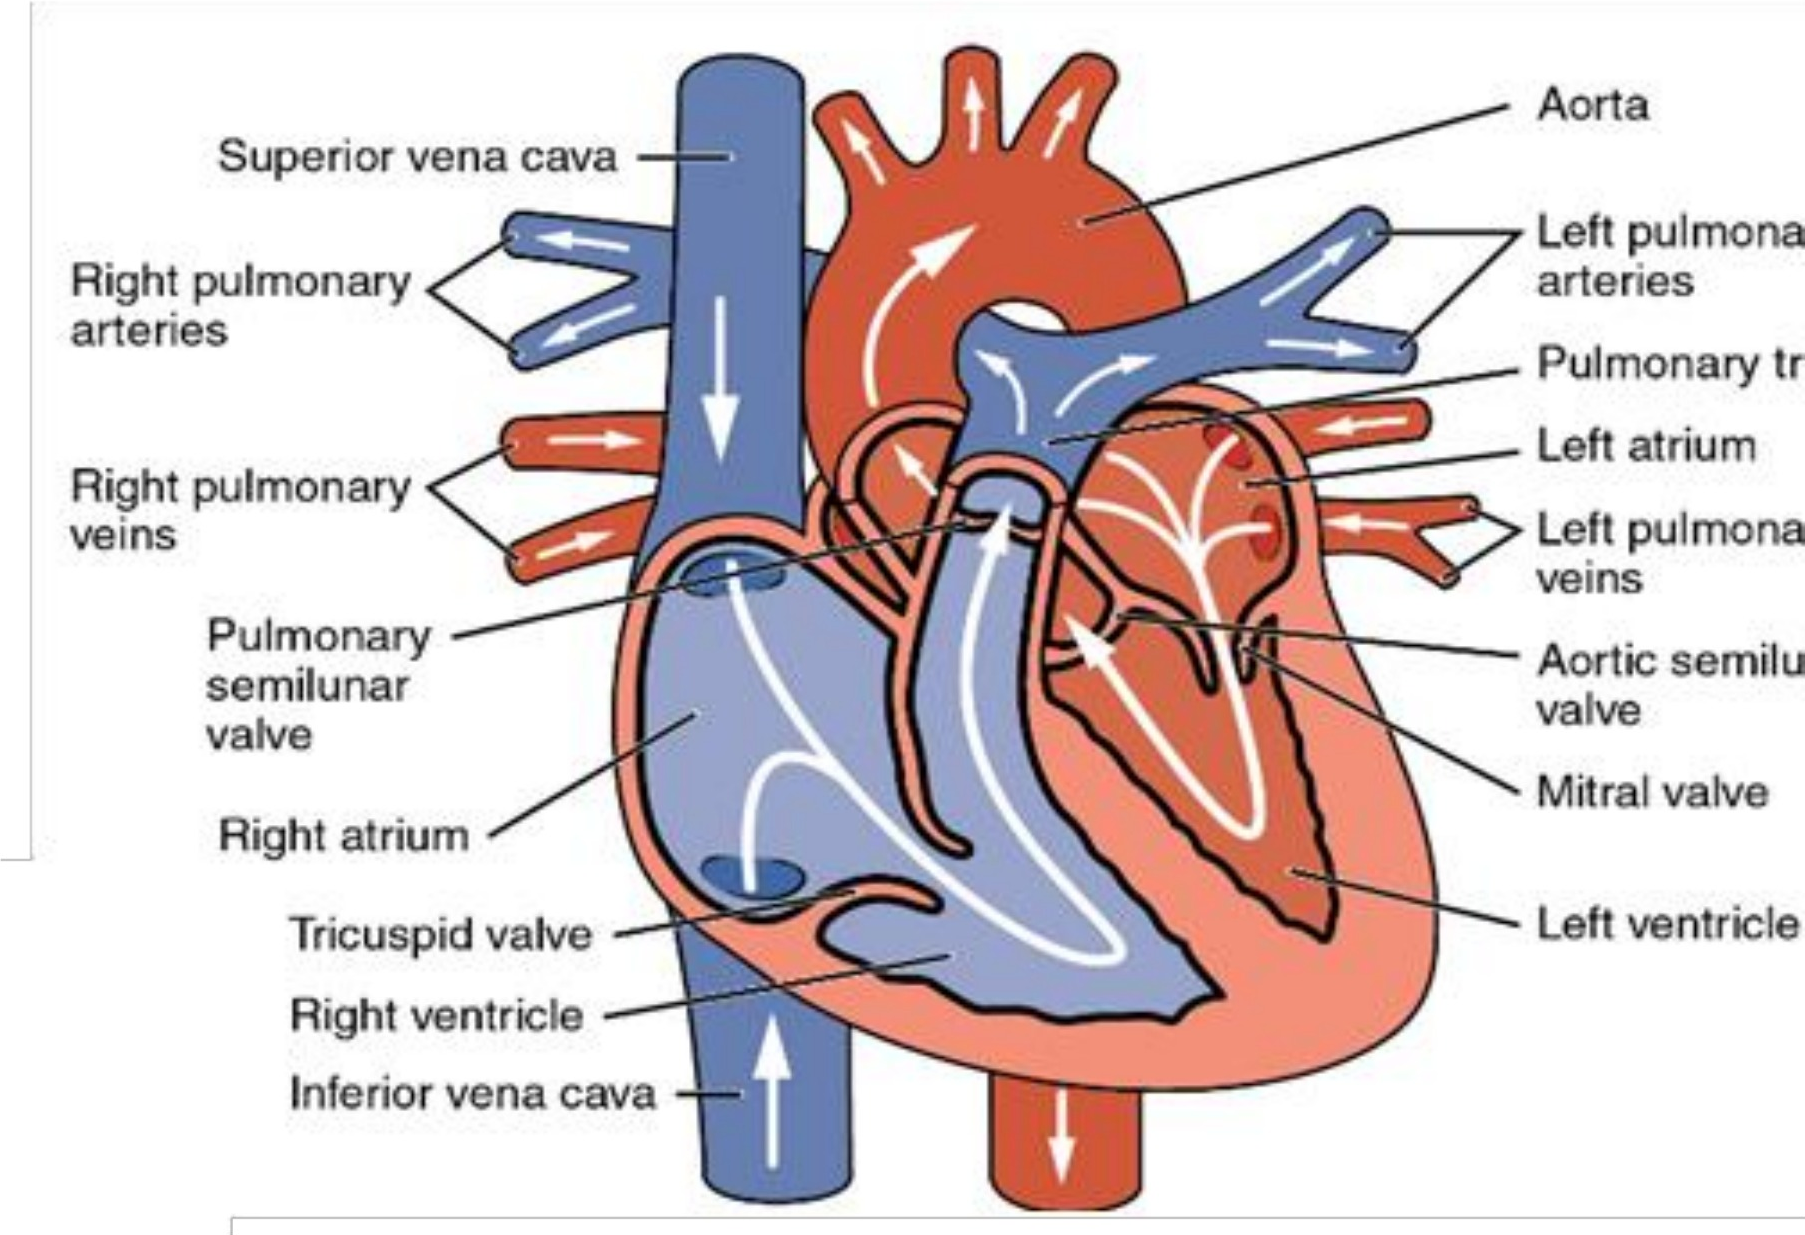
Figure 2-1. Human blood circulation showing the heart and the systemic and pulmonary circuits. The aortic valve sits at the exit of the left ventricle, controlling outflow into the aorta.
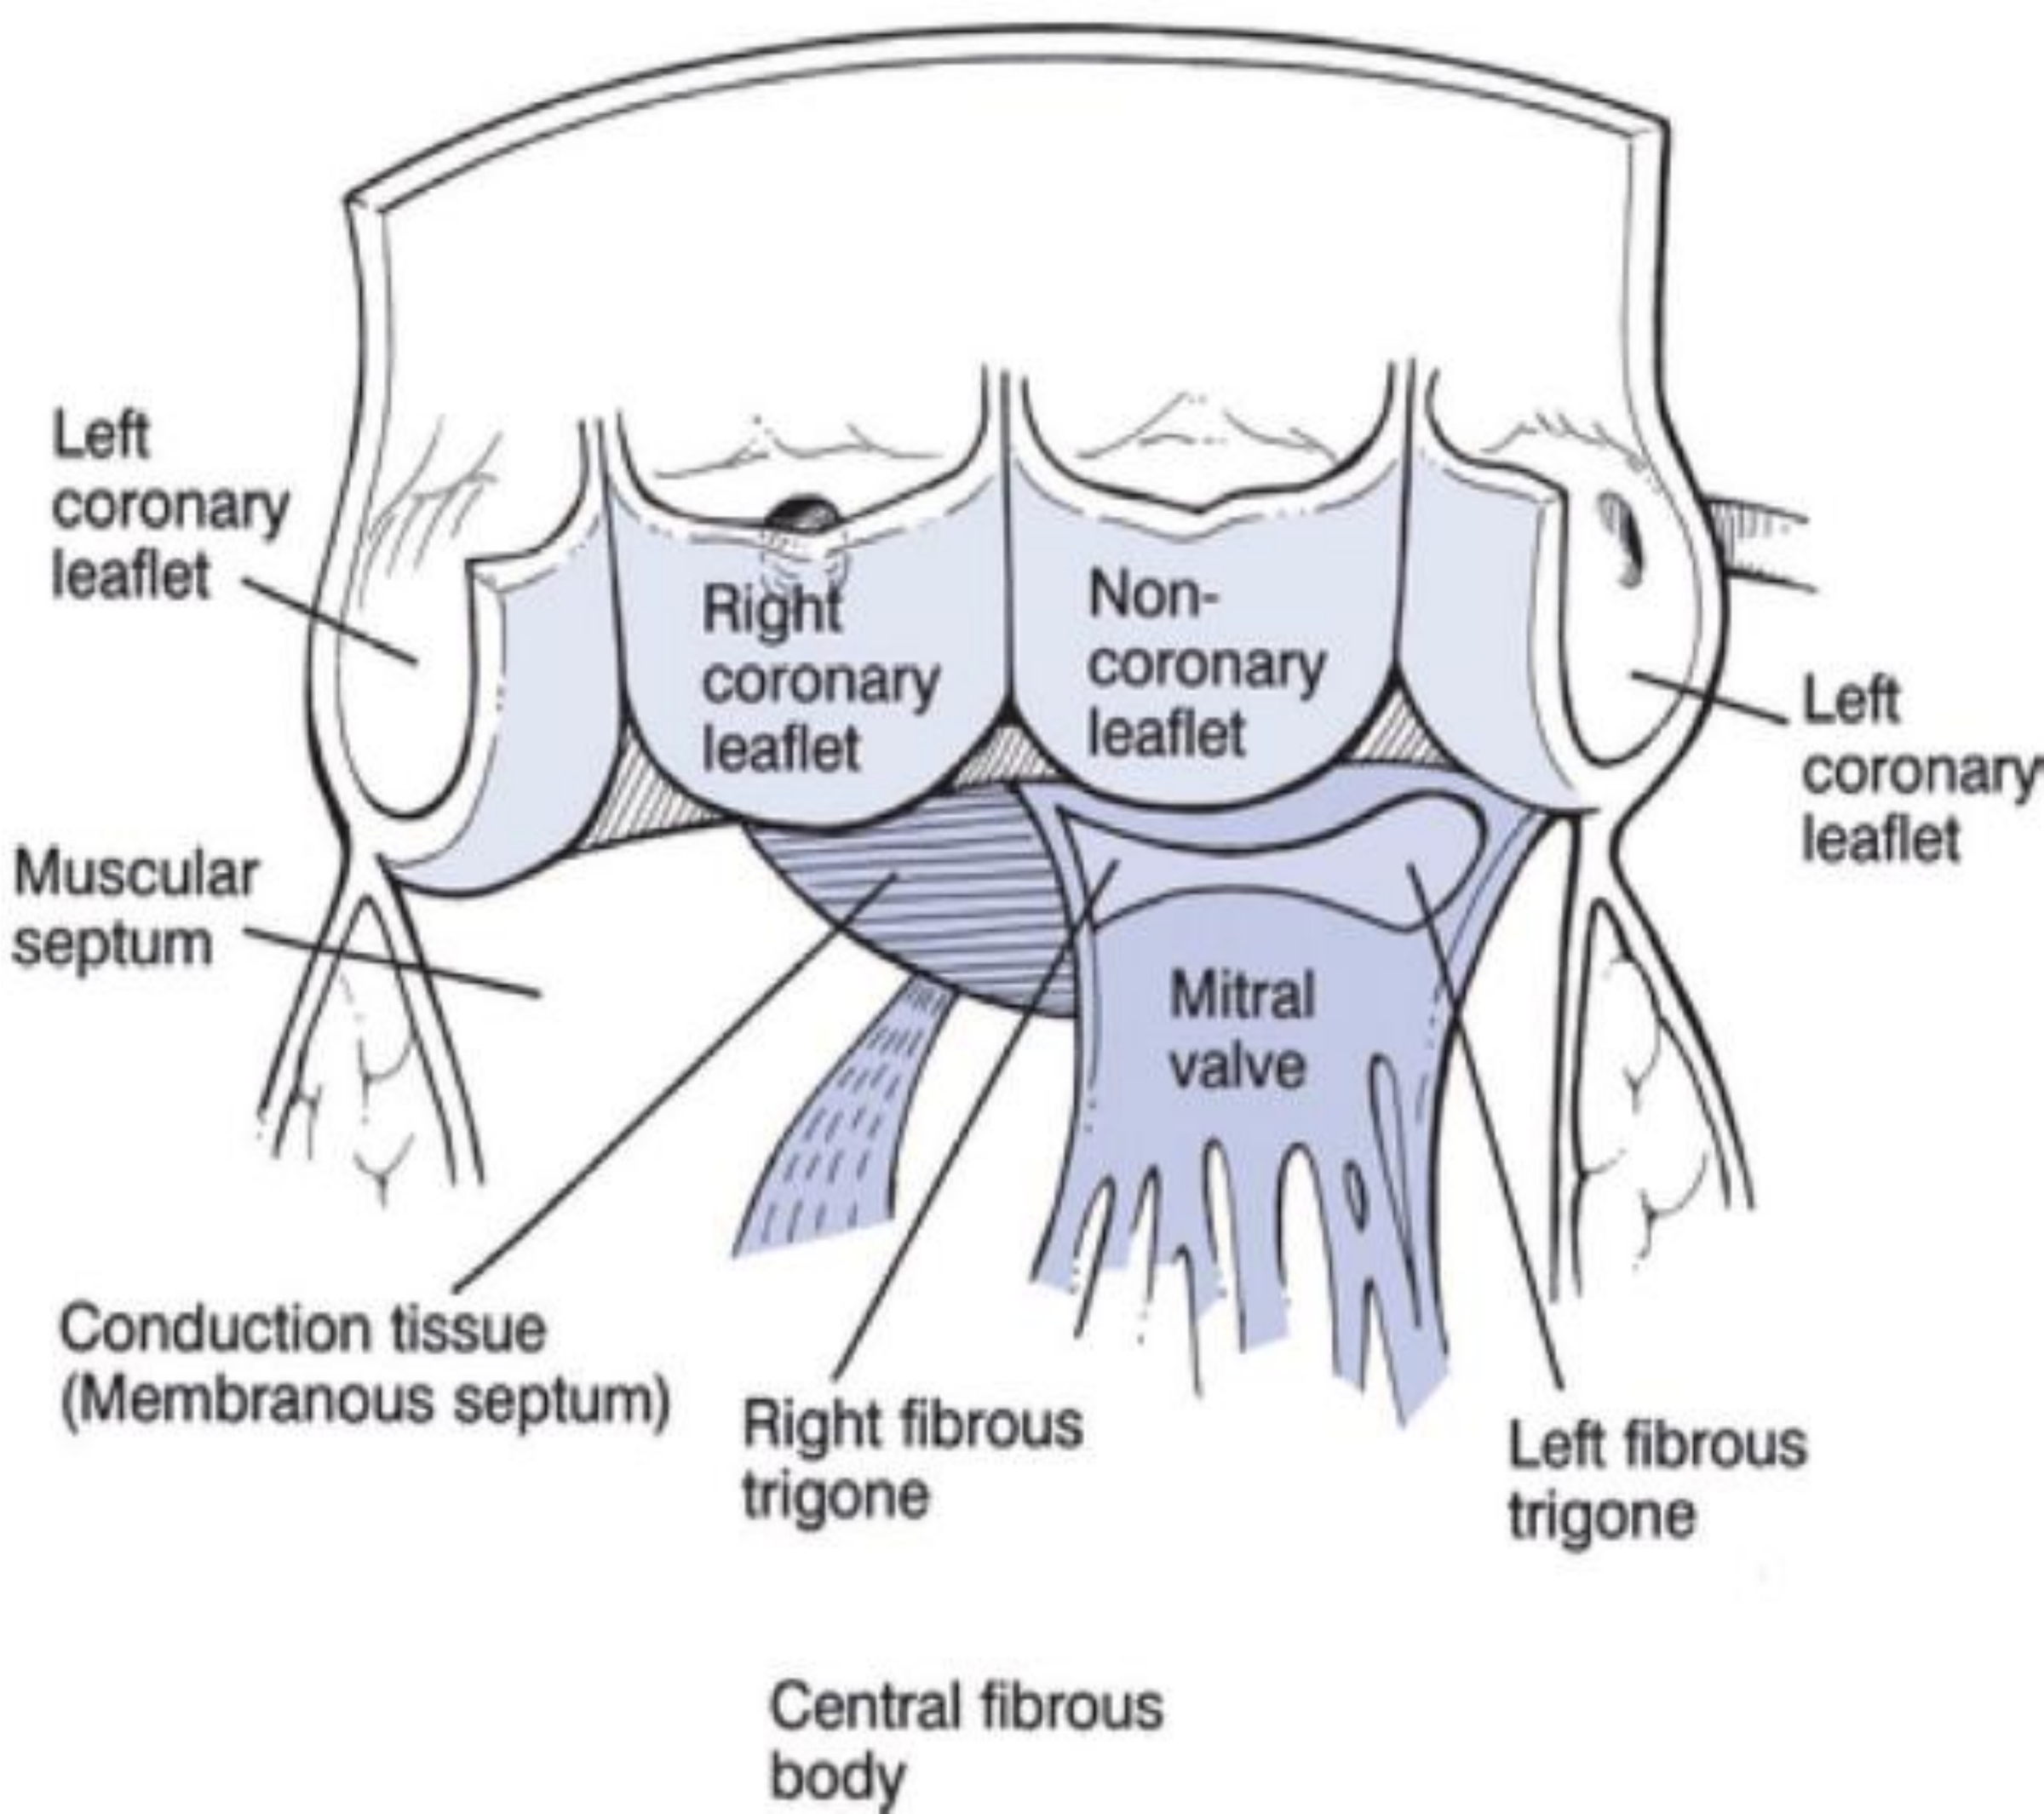
Figure 2-2. Cut-open view of the aortic and mitral valve leaflets showing the right coronary (R), left coronary (L), and non-coronary (N) cusps and the coronary outflow locations.
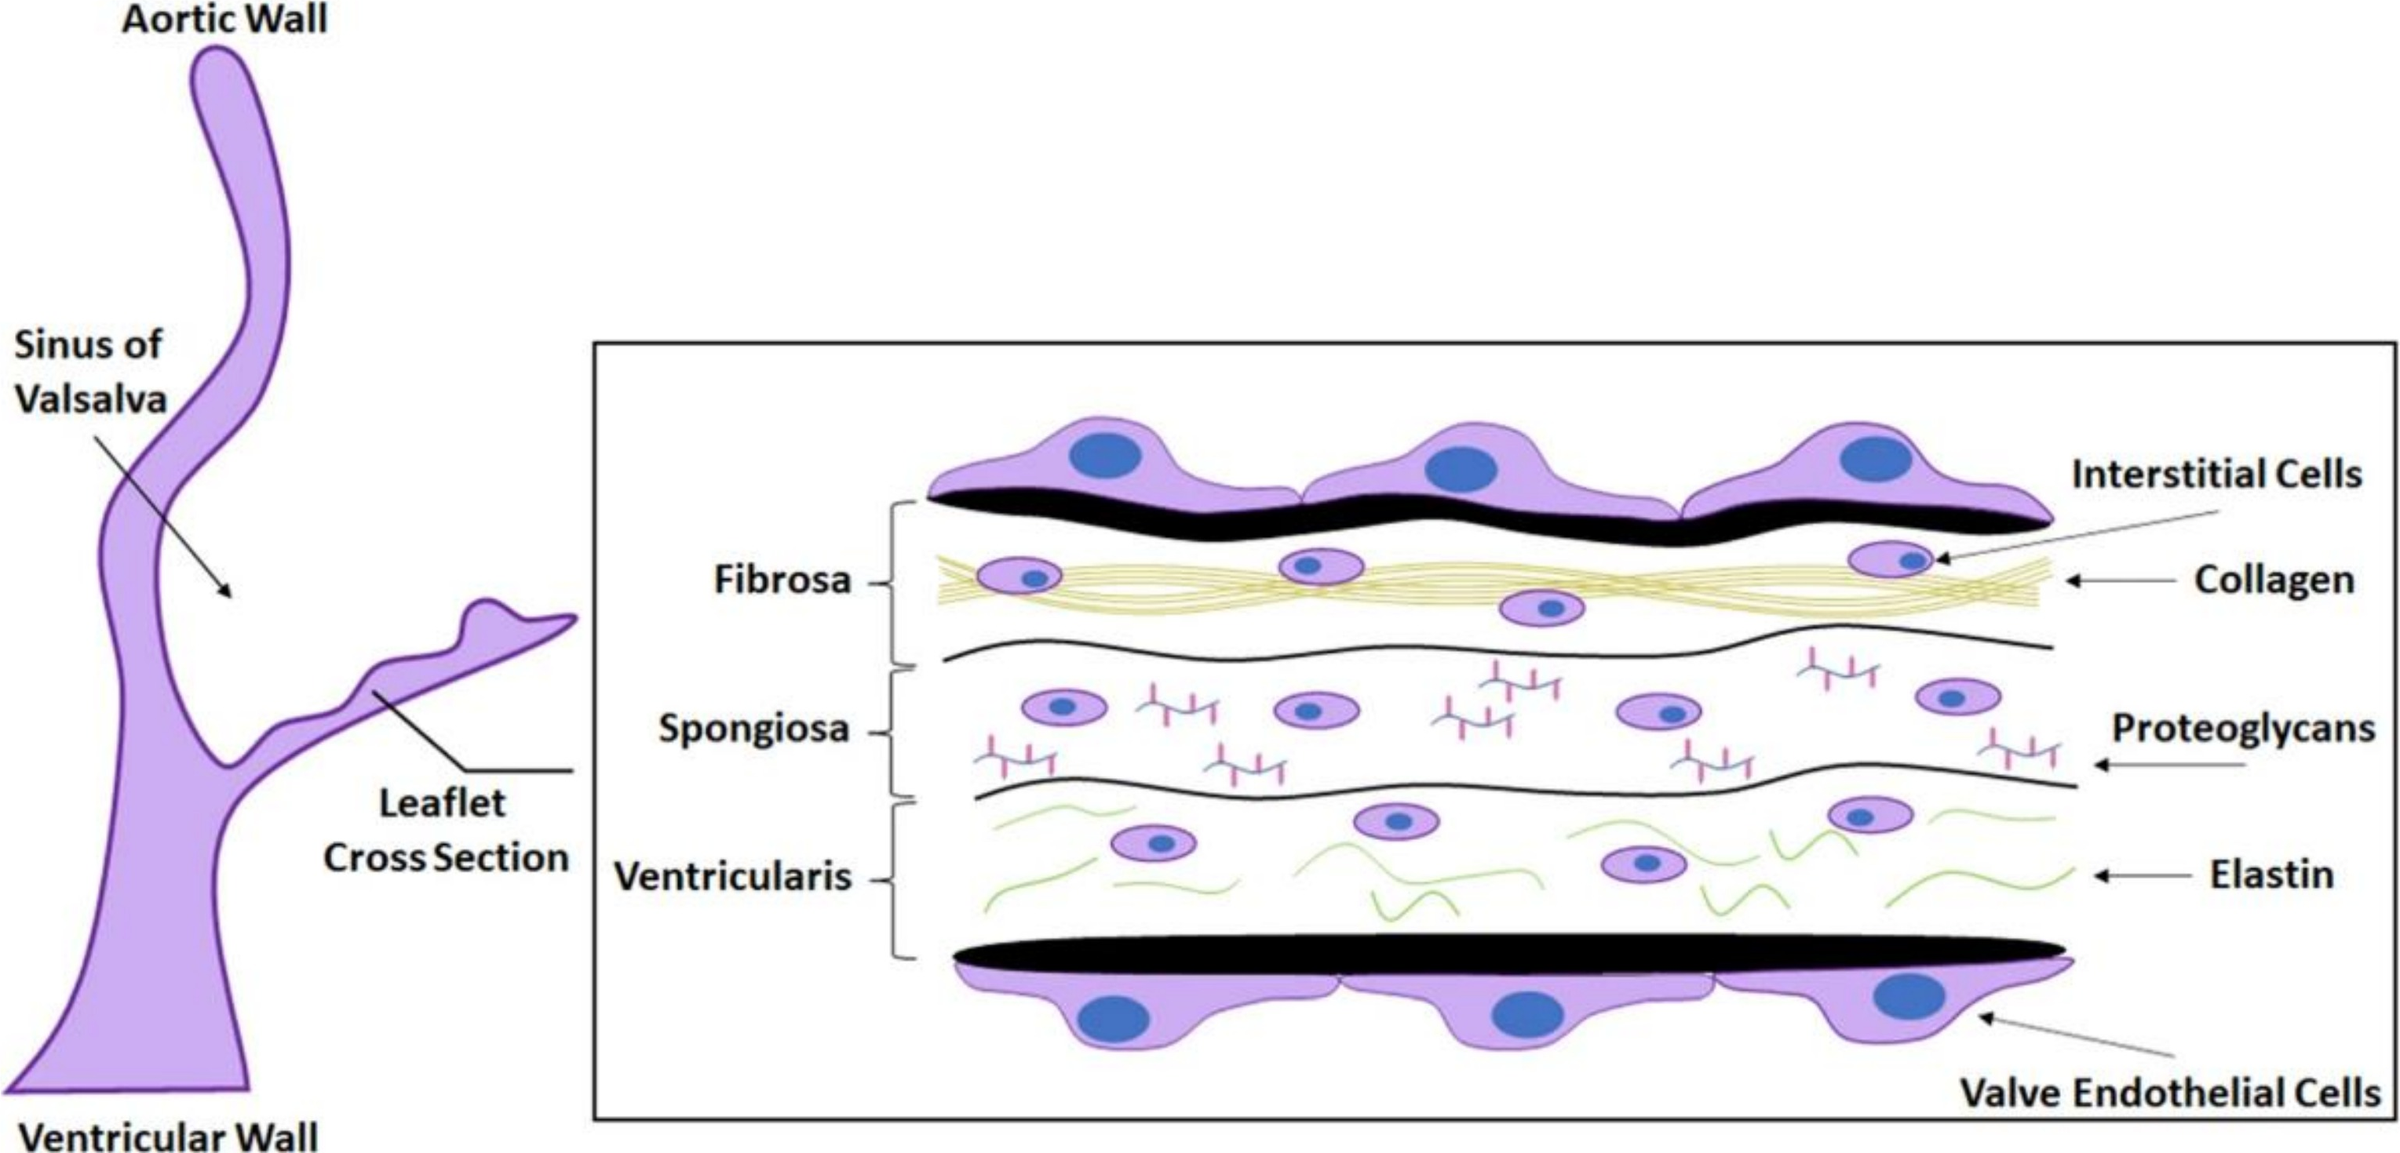
Figure 2-3. Cross-section of a human AV leaflet showing the tri-layer ECM: the ventricularis (elastin-rich, flow-facing), the spongiosa (proteoglycan core), and the fibrosa (collagen-rich, pressure-bearing). Valve interstitial cells (VICs) and endothelial cells (VECs) are the primary mediators of calcification.
The Clinical Problem
CAVD is asymptomatic in its early stages. Standard hydrodynamic parameters (ΔP, EOA, Qrms, RF) show no significant deviation from normal until the disease has advanced — making early intervention impossible without better biomarkers.
Hemodynamic Hypothesis
Abnormal wall shear stress (WSS) drives adverse endothelial cell remodeling and has been linked to atherosclerosis in arteries. This dissertation tests whether TAWSS and OSI serve similar roles as pre-symptomatic CAVD biomarkers at the valve leaflet surface.
Computational Methods
Patient-specific fluid-structure interaction (FSI) simulations in LS-DYNA and ANSYS using the arbitrary Lagrangian-Eulerian (ALE) method — Lagrangian solid domain tracking leaflet deformation, Eulerian fluid domain capturing blood flow through a deforming mesh.
CH. 4
Non-Newtonian Blood Modeling in Severely Calcified Valves
Published · J. Biomech. Eng. 2022
Wall shear stress predictions in cardiovascular CFD depend critically on the fluid viscosity model. In arteries, high shear rates keep blood in the Newtonian regime (constant viscosity), making the Newtonian approximation acceptable. The aortic valve, however, features complex geometry, dynamic motion, and crevice regions between calcific nodules where blood slows dramatically — conditions that may break the Newtonian assumption.
A patient-specific CT-reconstructed severely calcified human aortic valve (82-year-old female, Materialise Heart Print catalog) was computationally modeled across three configurations (diastole, early systole, peak systole) under both Newtonian and non-Newtonian (Carreau-Yasuda) viscosity models. The Carreau-Yasuda model captures shear-thinning: at low shear rates, blood viscosity rises substantially above the Newtonian constant.
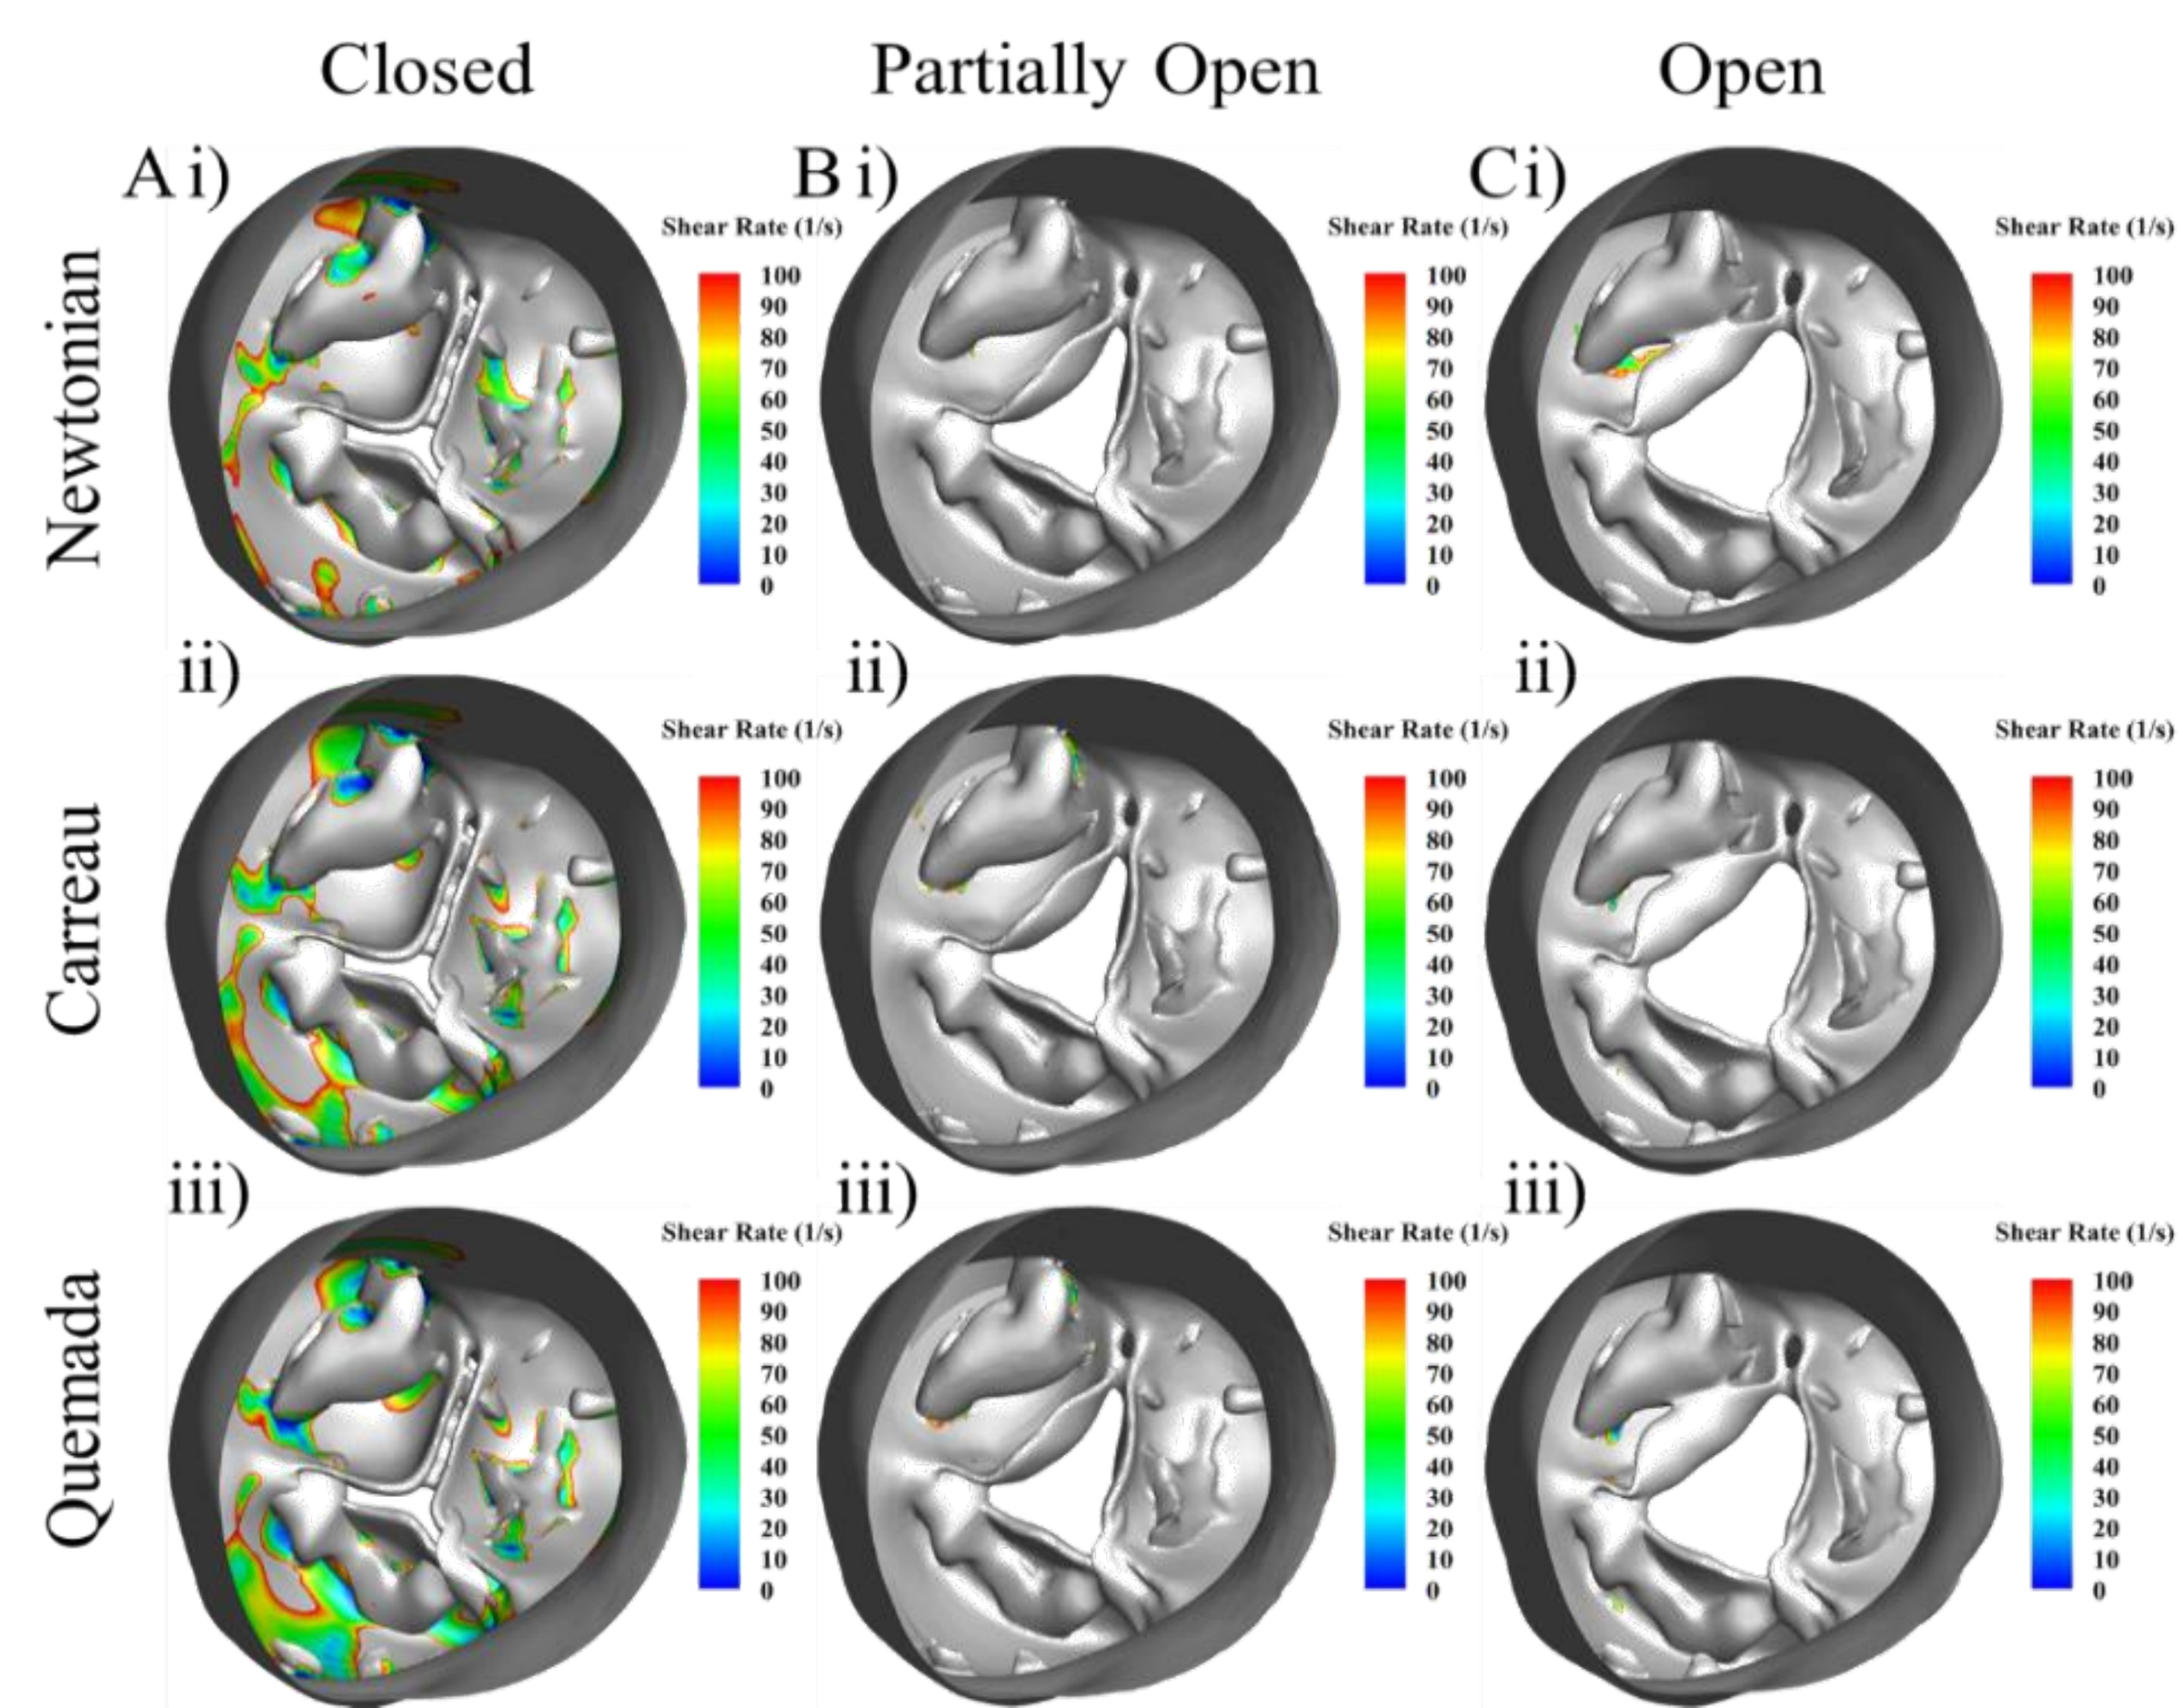
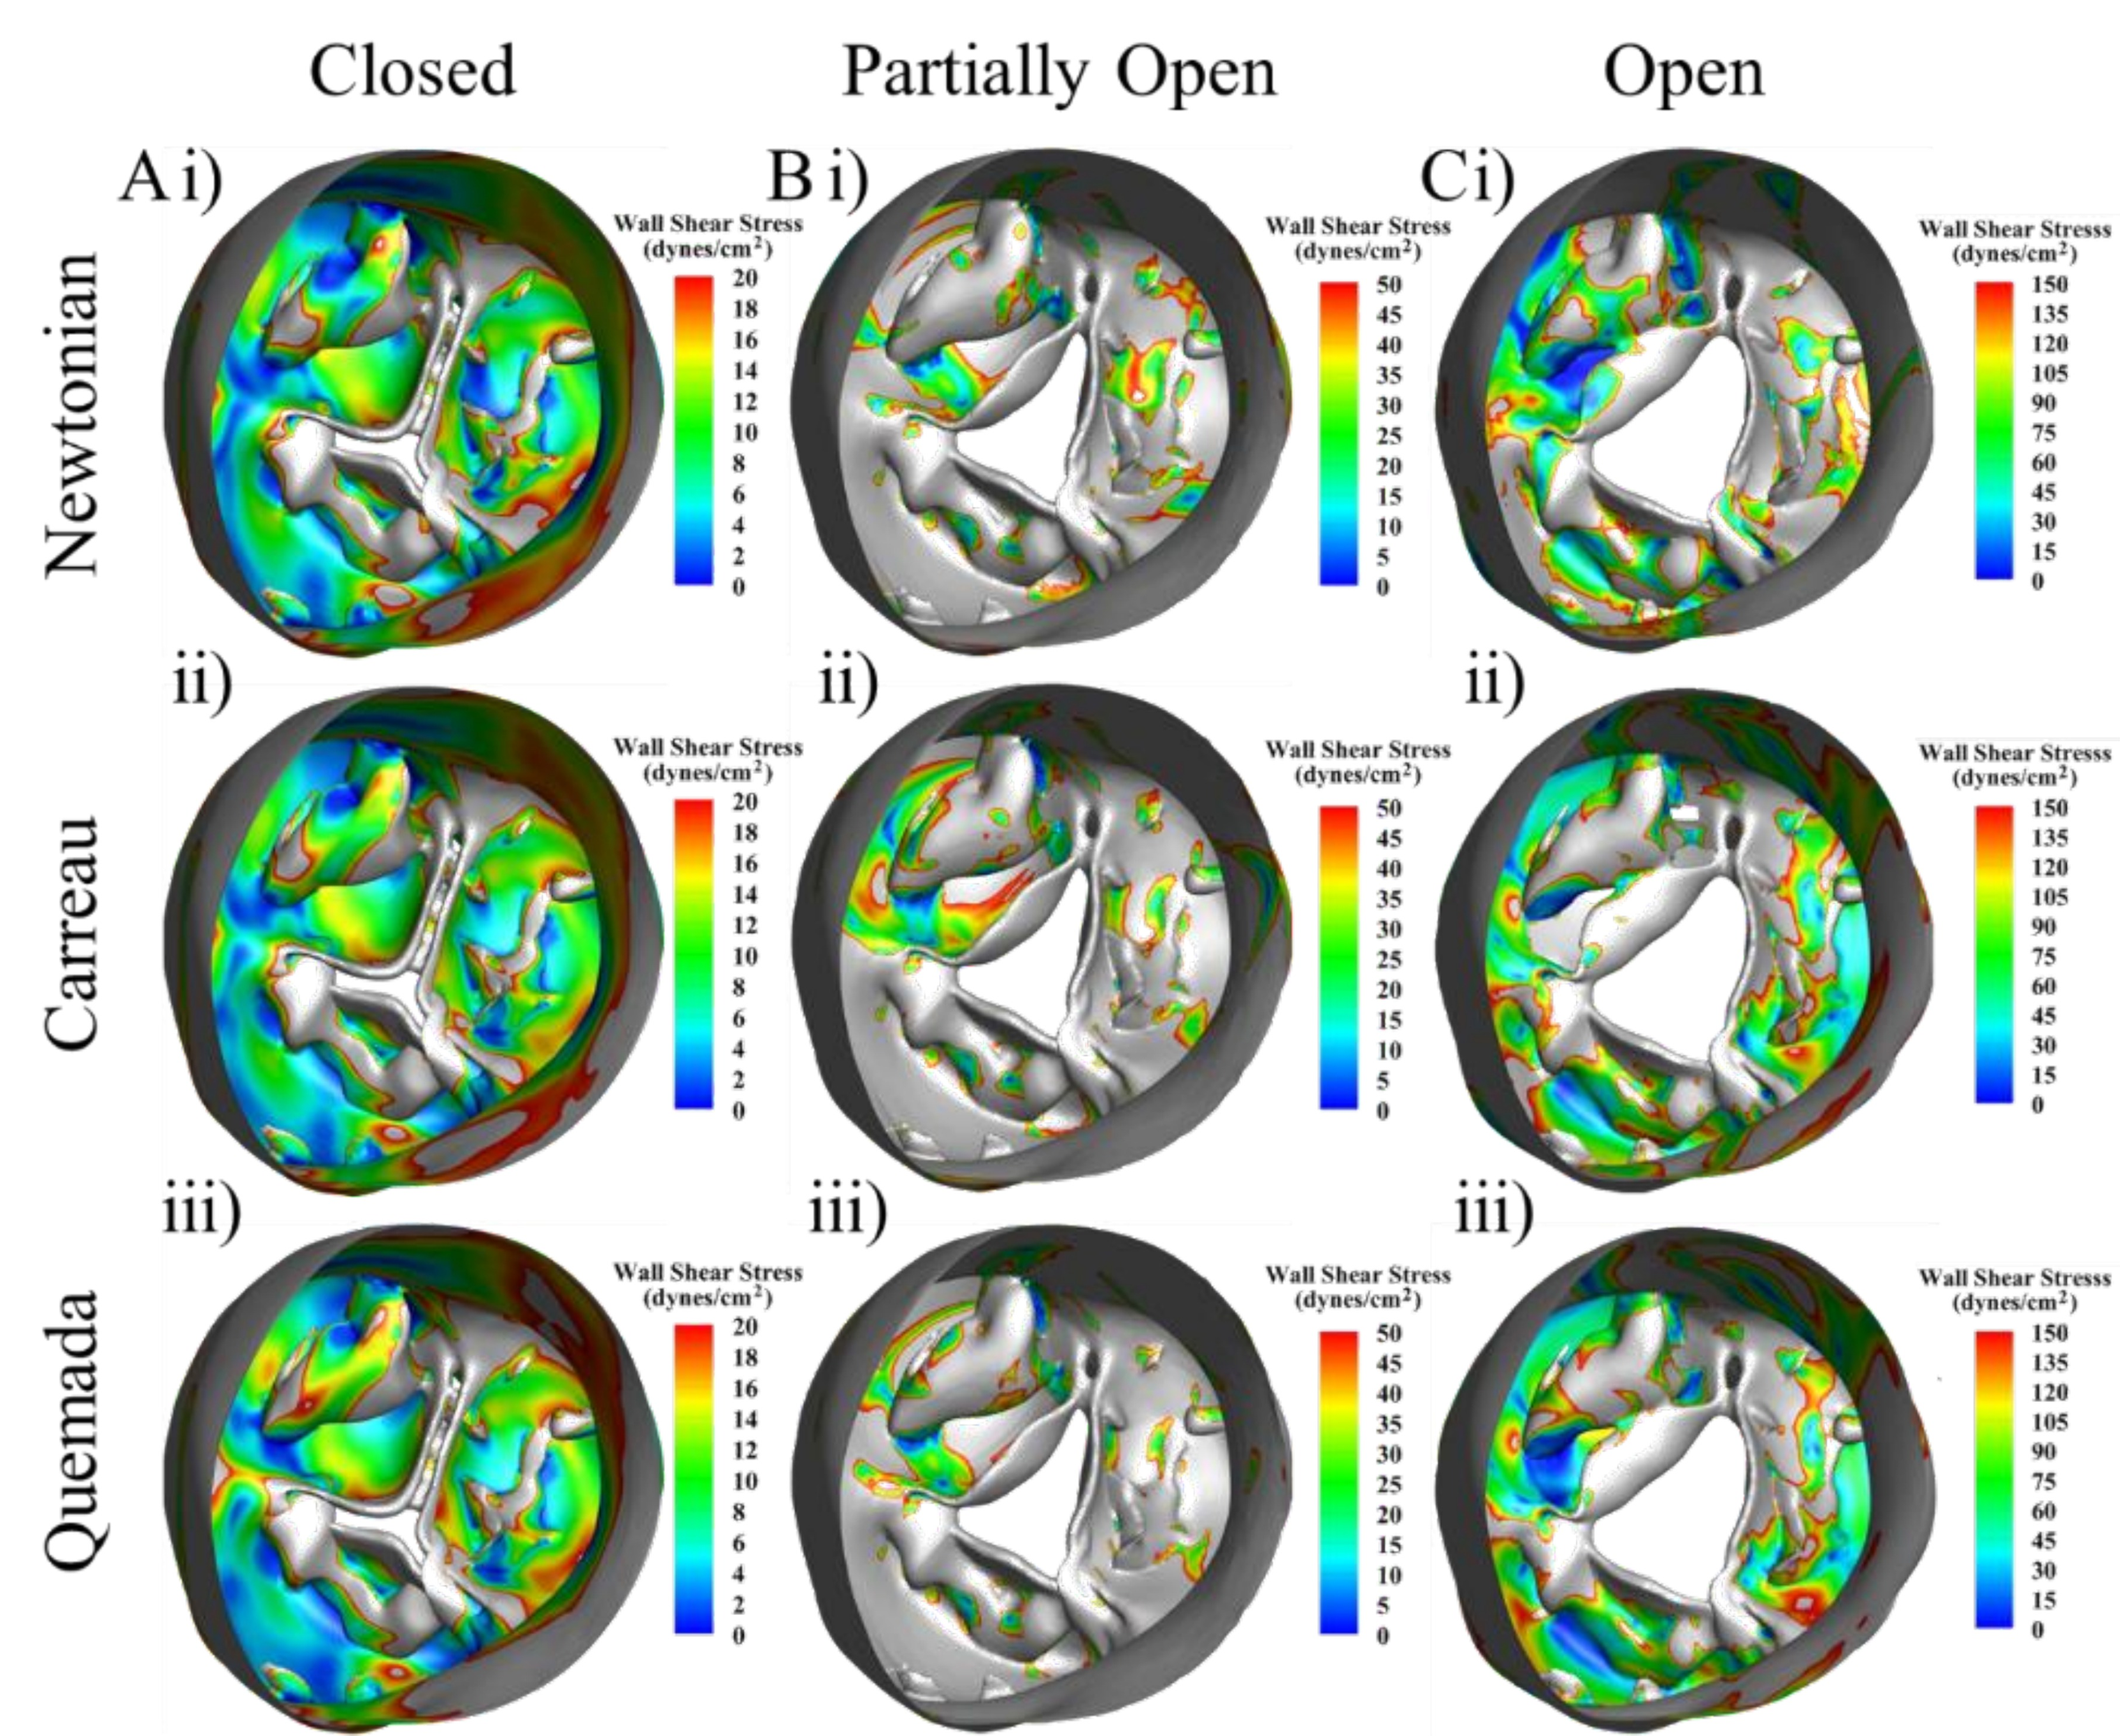
Key Finding: The fibrosa (pressure-bearing) surface of severely calcified leaflets, particularly within the crevice regions between nodules, experiences shear rates below the Newtonian threshold. Under these conditions, blood viscosity is significantly higher than the Newtonian constant — leading Newtonian models to artificially underpredict WSS in precisely the regions most relevant to CAVD progression. Accurate FSI modeling of severely calcified valves therefore requires a non-Newtonian viscosity model.
Newtonian Underprediction
Newtonian models produced artificially lower WSS in fibrosa crevice regions compared to non-Newtonian models — because they cannot capture the increased viscosity at low shear rates.
Clinical Implication
If biomarker studies use Newtonian models for severe CAVD, WSS predictions will be systematically biased — potentially masking the true hemodynamic signal linked to calcification and thrombosis risk.
Design Decision
All subsequent FSI simulations in this dissertation use non-Newtonian blood models where appropriate, informed by local shear rate assessments.
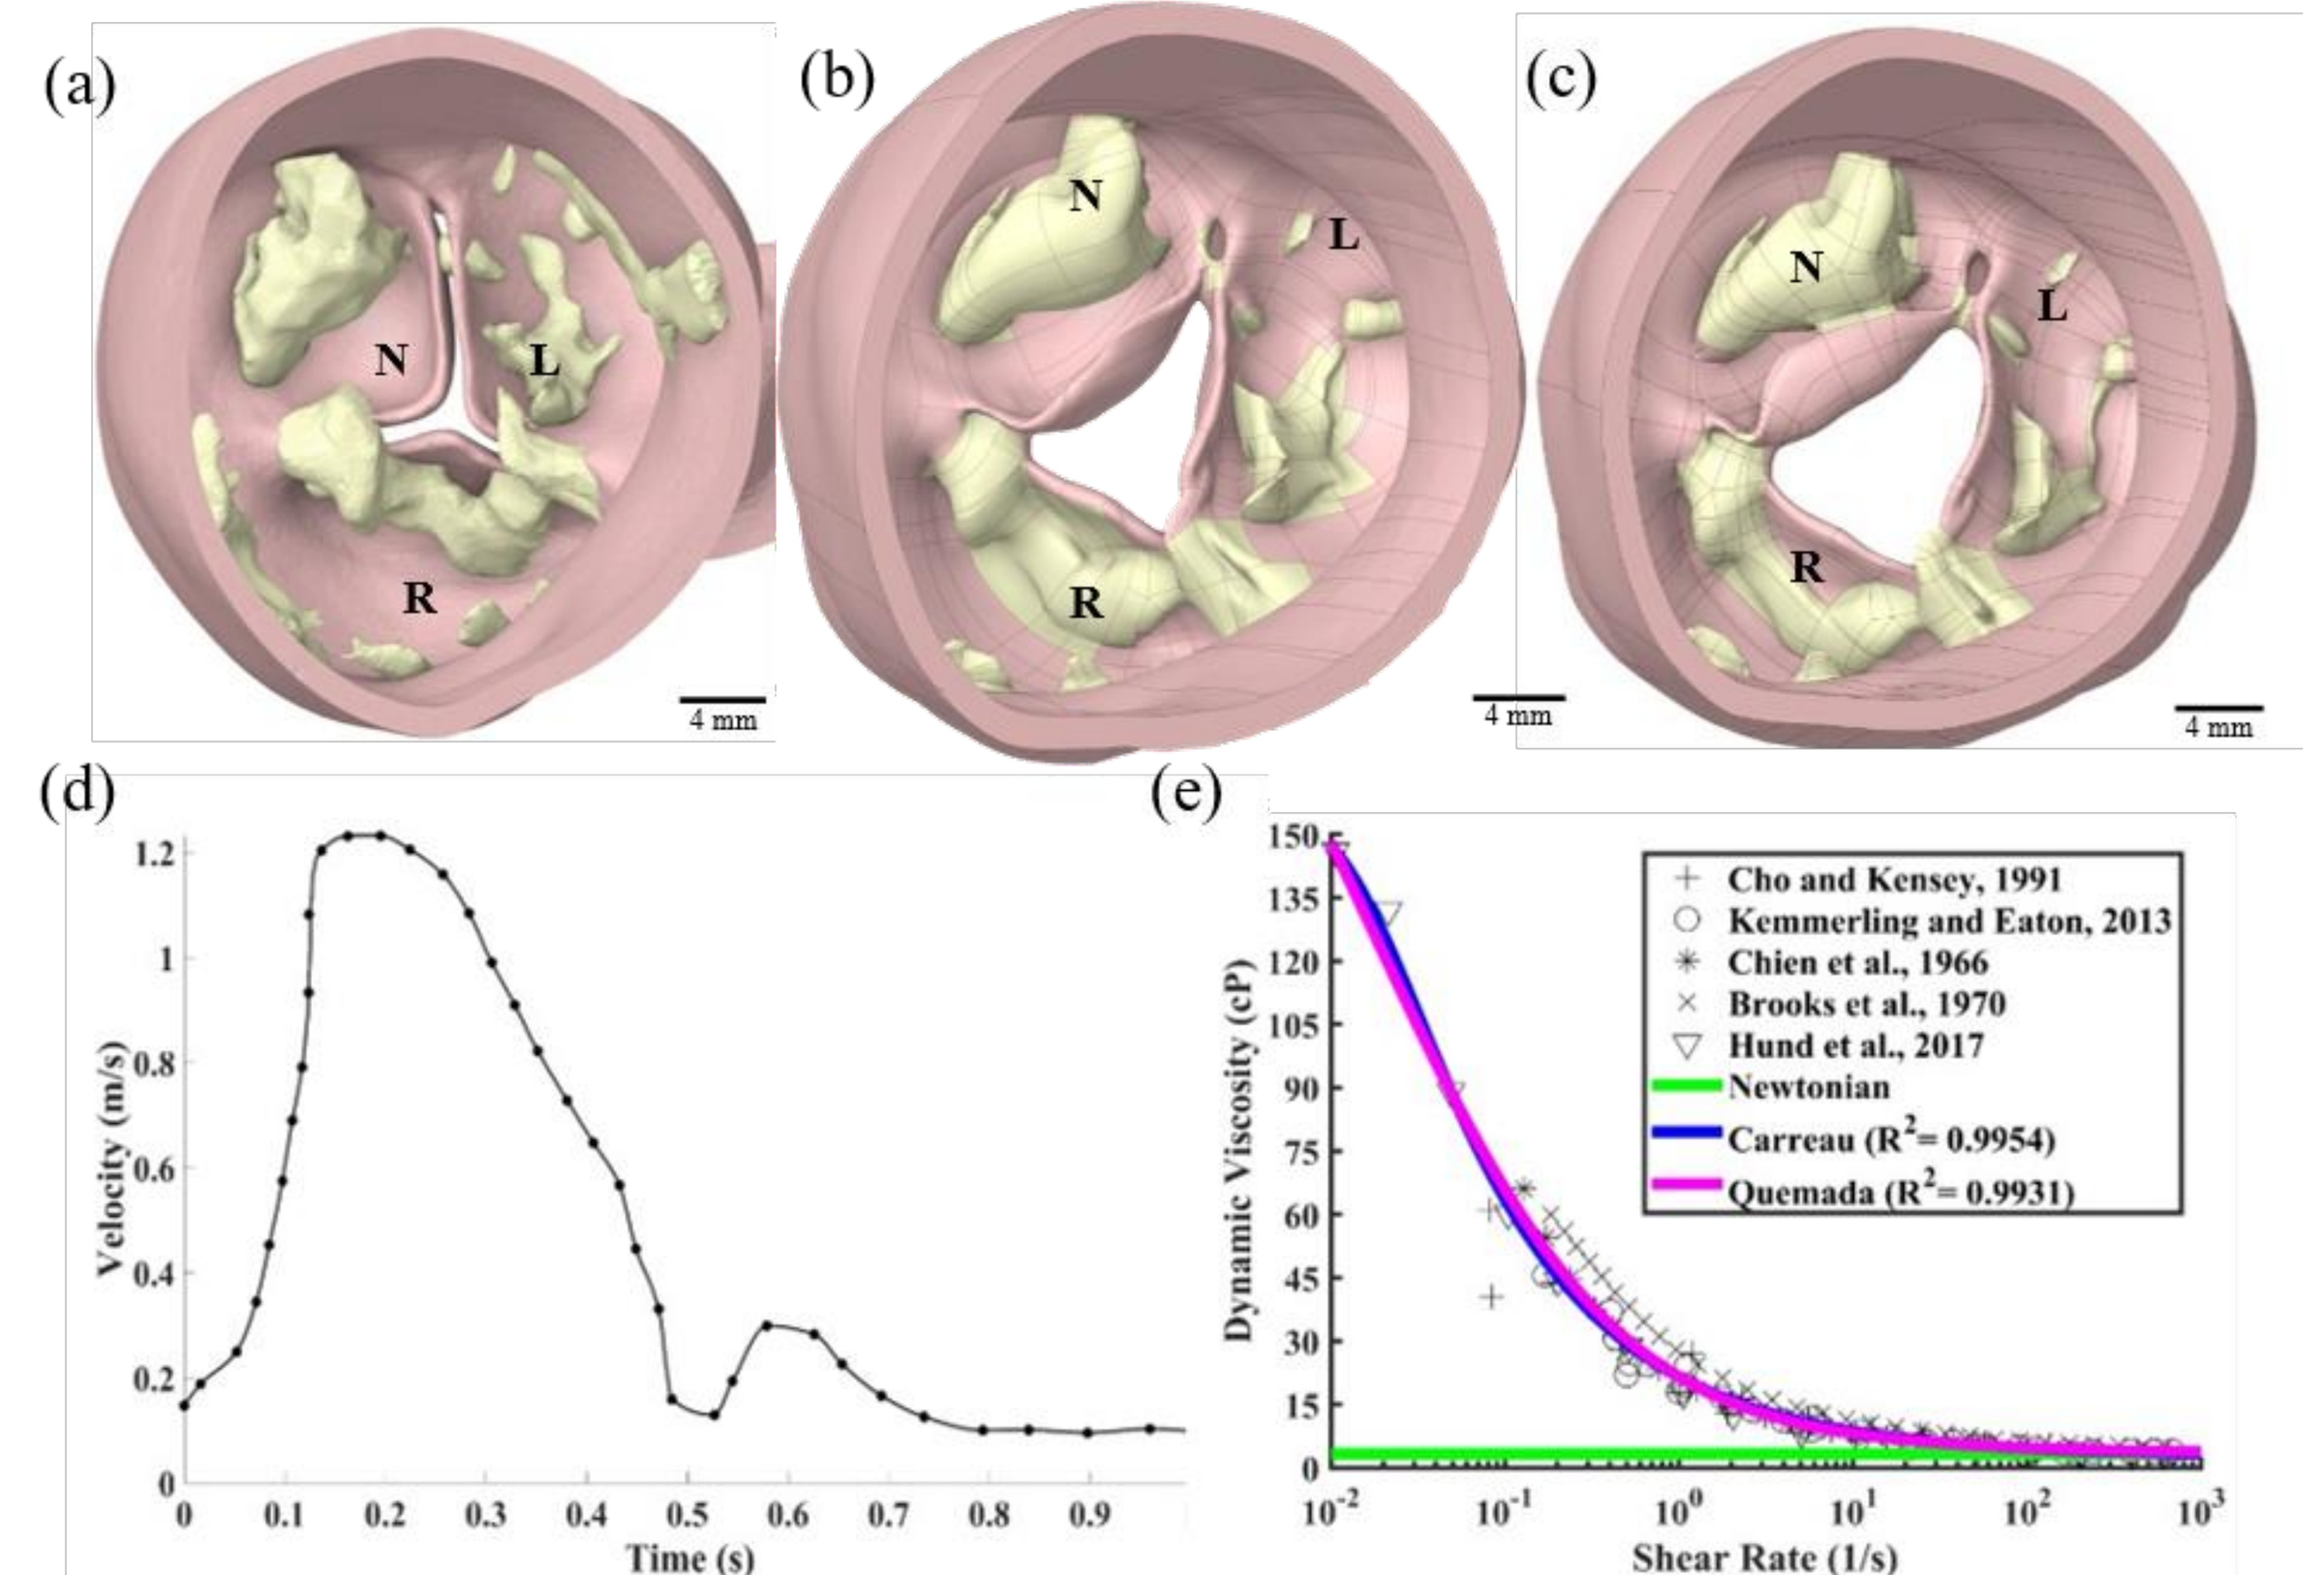
Figure 4-1. CFD model preparation. (a–c) CT-reconstructed severely calcified aortic valve in diastolic, early-systolic, and peak-systolic configurations. (d) Inlet velocity profile boundary condition. (e) Non-Newtonian viscosity model fittings — Carreau (R²=0.9954) and Quemada (R²=0.9931).
Figure 4-2. Fibrosa-side quasi-static shear rates for each valve configuration — closed (A), partially open (B), open (C) — comparing Newtonian (i), Carreau (ii), and Quemada (iii) viscosity models. Values above 100 s⁻¹ are clipped. Only inner cusp regions are shown.
Figure 4-3. Fibrosa-side quasi-static wall shear stress (WSS) for each configuration and viscosity model. Non-Newtonian models predict substantially higher WSS in crevice regions where shear rates fall below 100 s⁻¹.
1
Mirza A*, Ramaswamy S. Importance of Non-Newtonian Computational Fluid Modeling on Severely Calcified Aortic Valve Geometries.
Journal of Biomechanical Engineering. 2022;144(11). ASME.
Early-Stage CAVD Biomarkers Using PSIS Bioscaffold Valves
Core Aim 1
The central challenge of CAVD biomarker development is capturing the pre-symptomatic stage — when standard clinical parameters show no abnormality but calcification is already altering the valve's mechanical and hemodynamic environment. This chapter creates and characterizes an in vitro early-stage CAVD model using porcine small intestinal submucosa (PSIS) bioscaffolds seeded with valve interstitial cells (VICs) and valve endothelial cells (VECs) cultured in pro-calcific media, then evaluates whether TAWSS and OSI can detect disease that hydrodynamics cannot.
PSIS scaffold preparation
→
VIC/VEC seeding
→
Pro-calcific media (7 days)
→
Hydrodynamic testing (Vivitro)
→
Nanoindentation
→
FSI simulation
→
TAWSS / OSI analysis
Experimental Groups (n=3 per group)
Group A — Raw PSISHealthy control; no cells, no culture
Group B — Static CalcificPSIS + VIC/VEC in pro-calcific media, no flow (OSI = 0, static culture, 7 days)
Group C — Bioreactor CalcificPSIS + VIC/VEC in pro-calcific media + oscillatory shear (OSI = 0.5, 3–4 dyn/cm², 7 days)
p<0.05
Nanoindentation stiffness difference: healthy vs. calcified
+28%
TAWSS increase: healthy → mildly calcified
↓ OSI
Reduction in oscillatory shear index with calcification
No Δ
Hydrodynamic parameters (ΔP, RF, EOA, Q) between groups
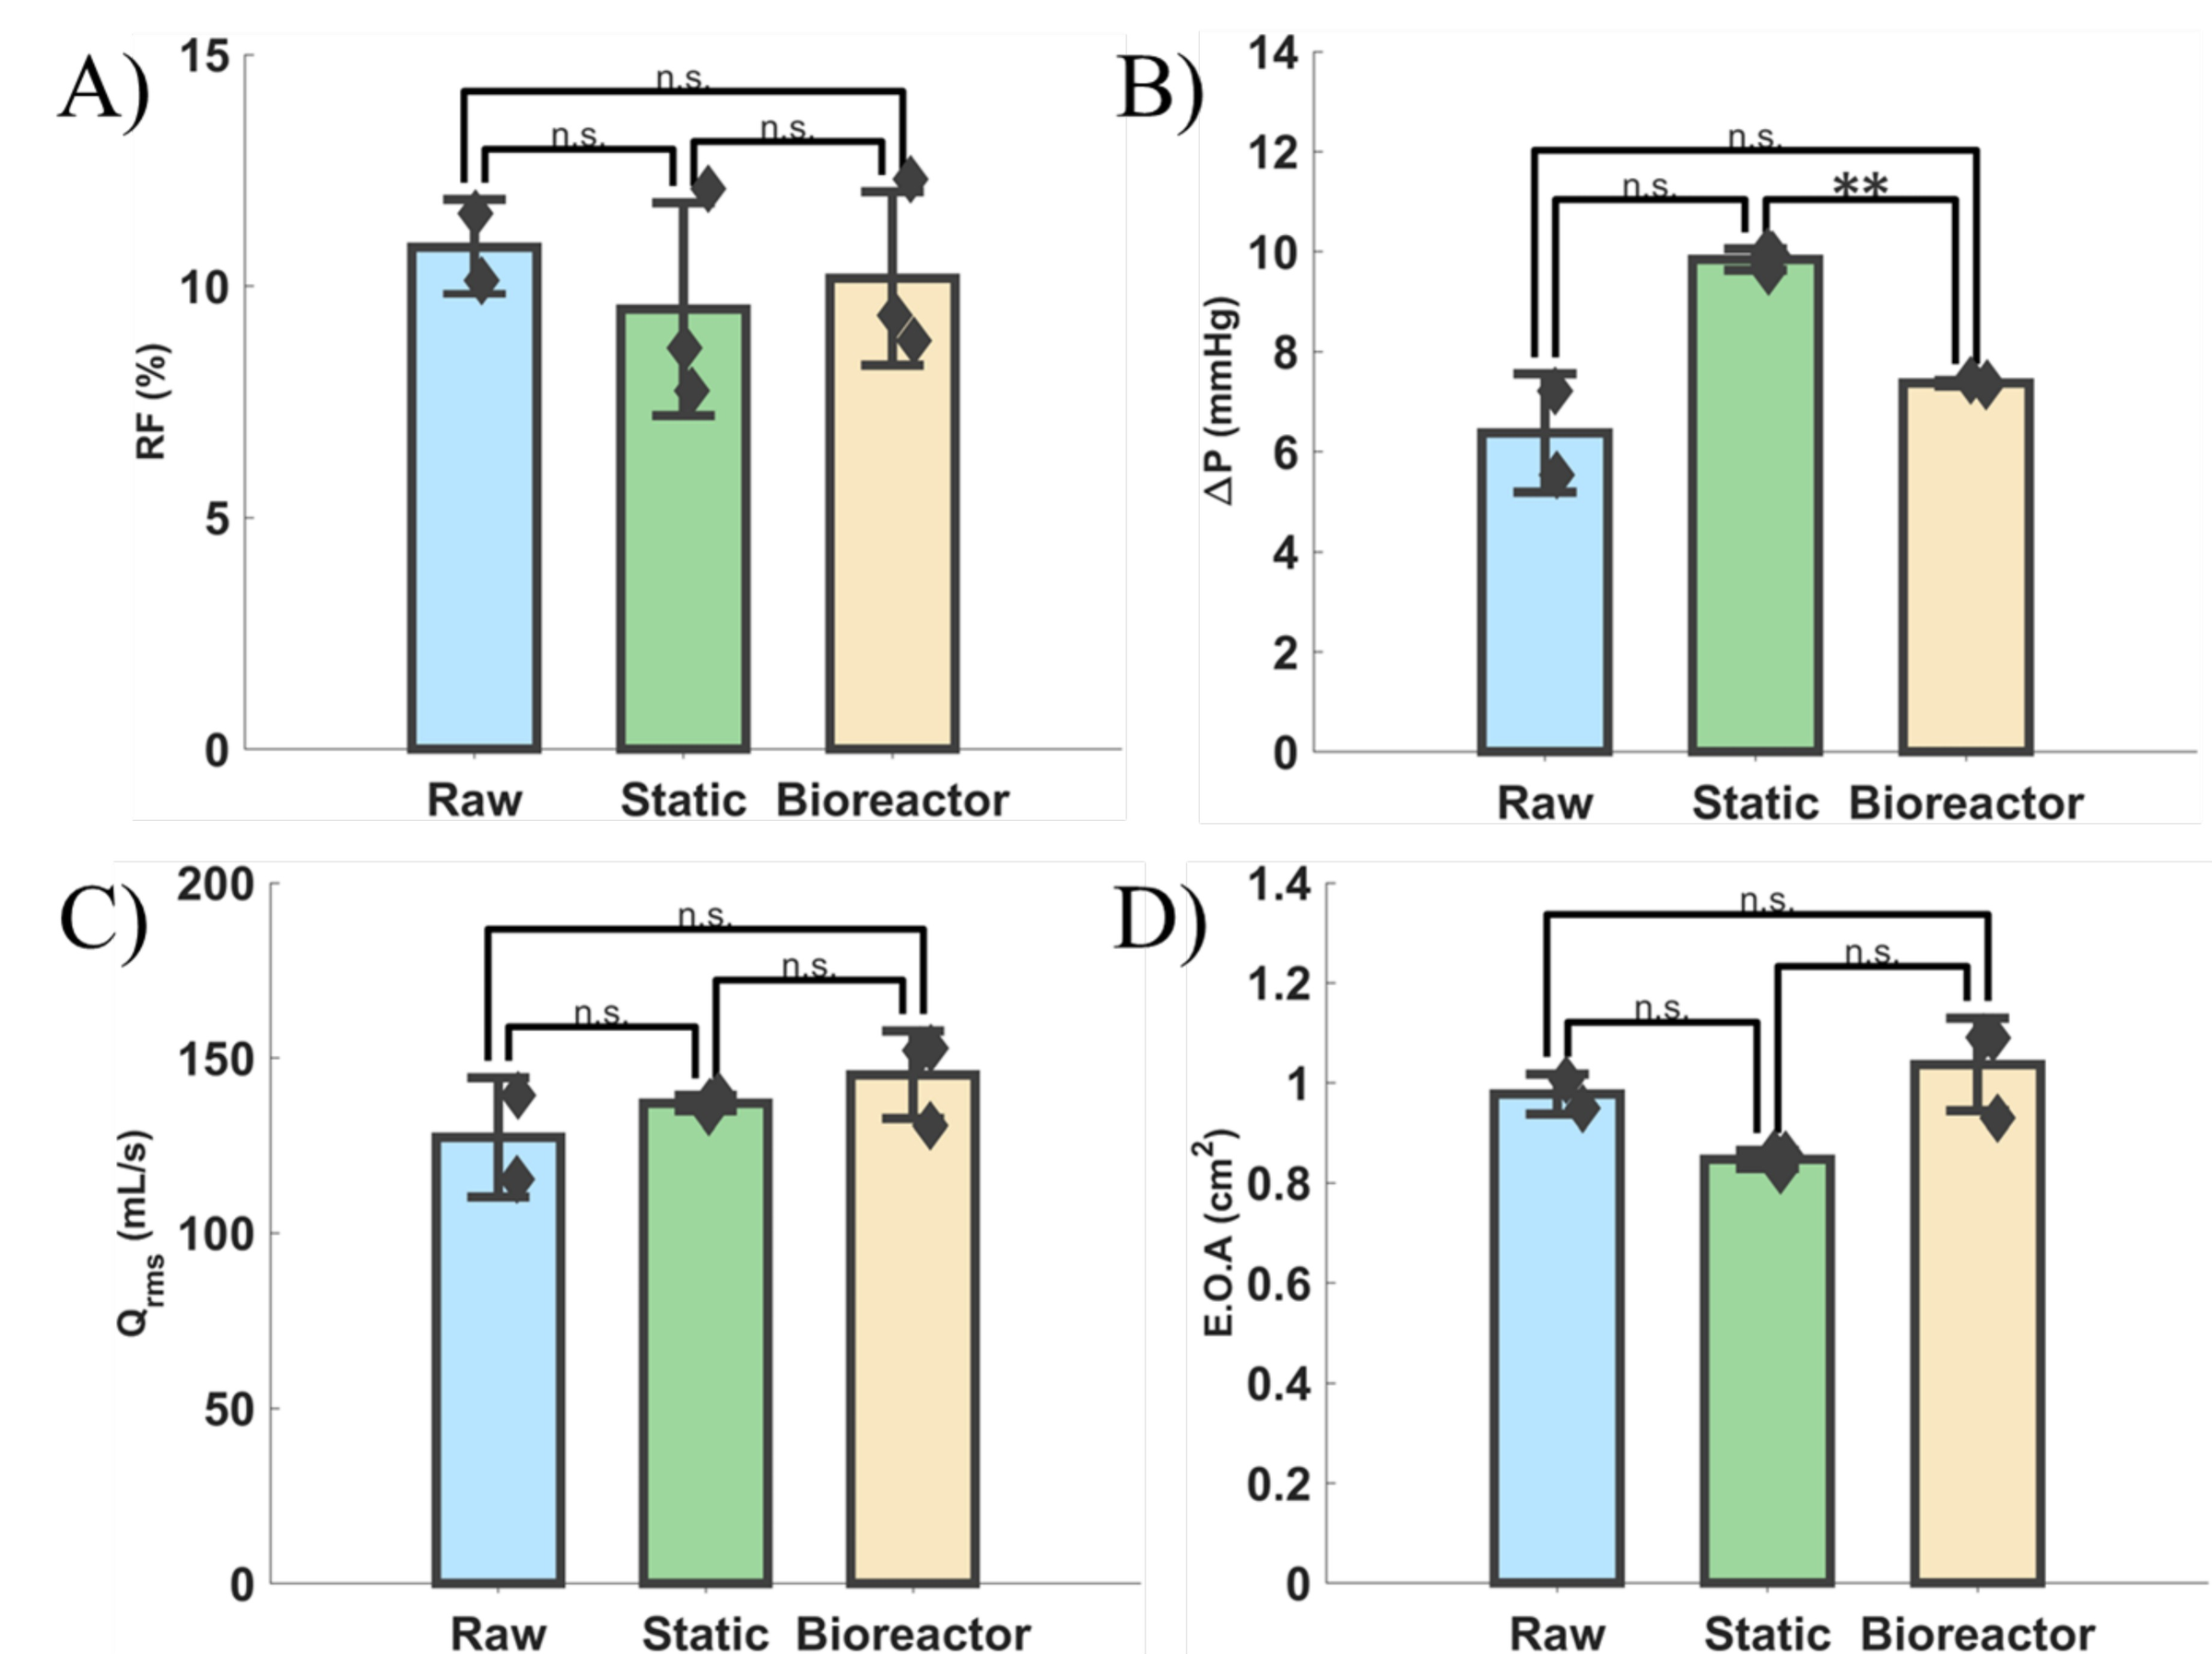
Key Finding: Conventional hydrodynamic parameters (ΔP, RF, Qrms, EOA) showed no statistically significant differences between healthy and mildly calcified PSIS valves — consistent with clinical observations of CAVD's asymptomatic early phase. However, nanoindentation revealed significantly increased stiffness (p<0.05) in calcified valves, and FSI simulations showed a 28% increase in TAWSS and reduction in OSI. TAWSS and OSI are therefore measurable hemodynamic biomarkers of early-stage, pre-symptomatic CAVD.
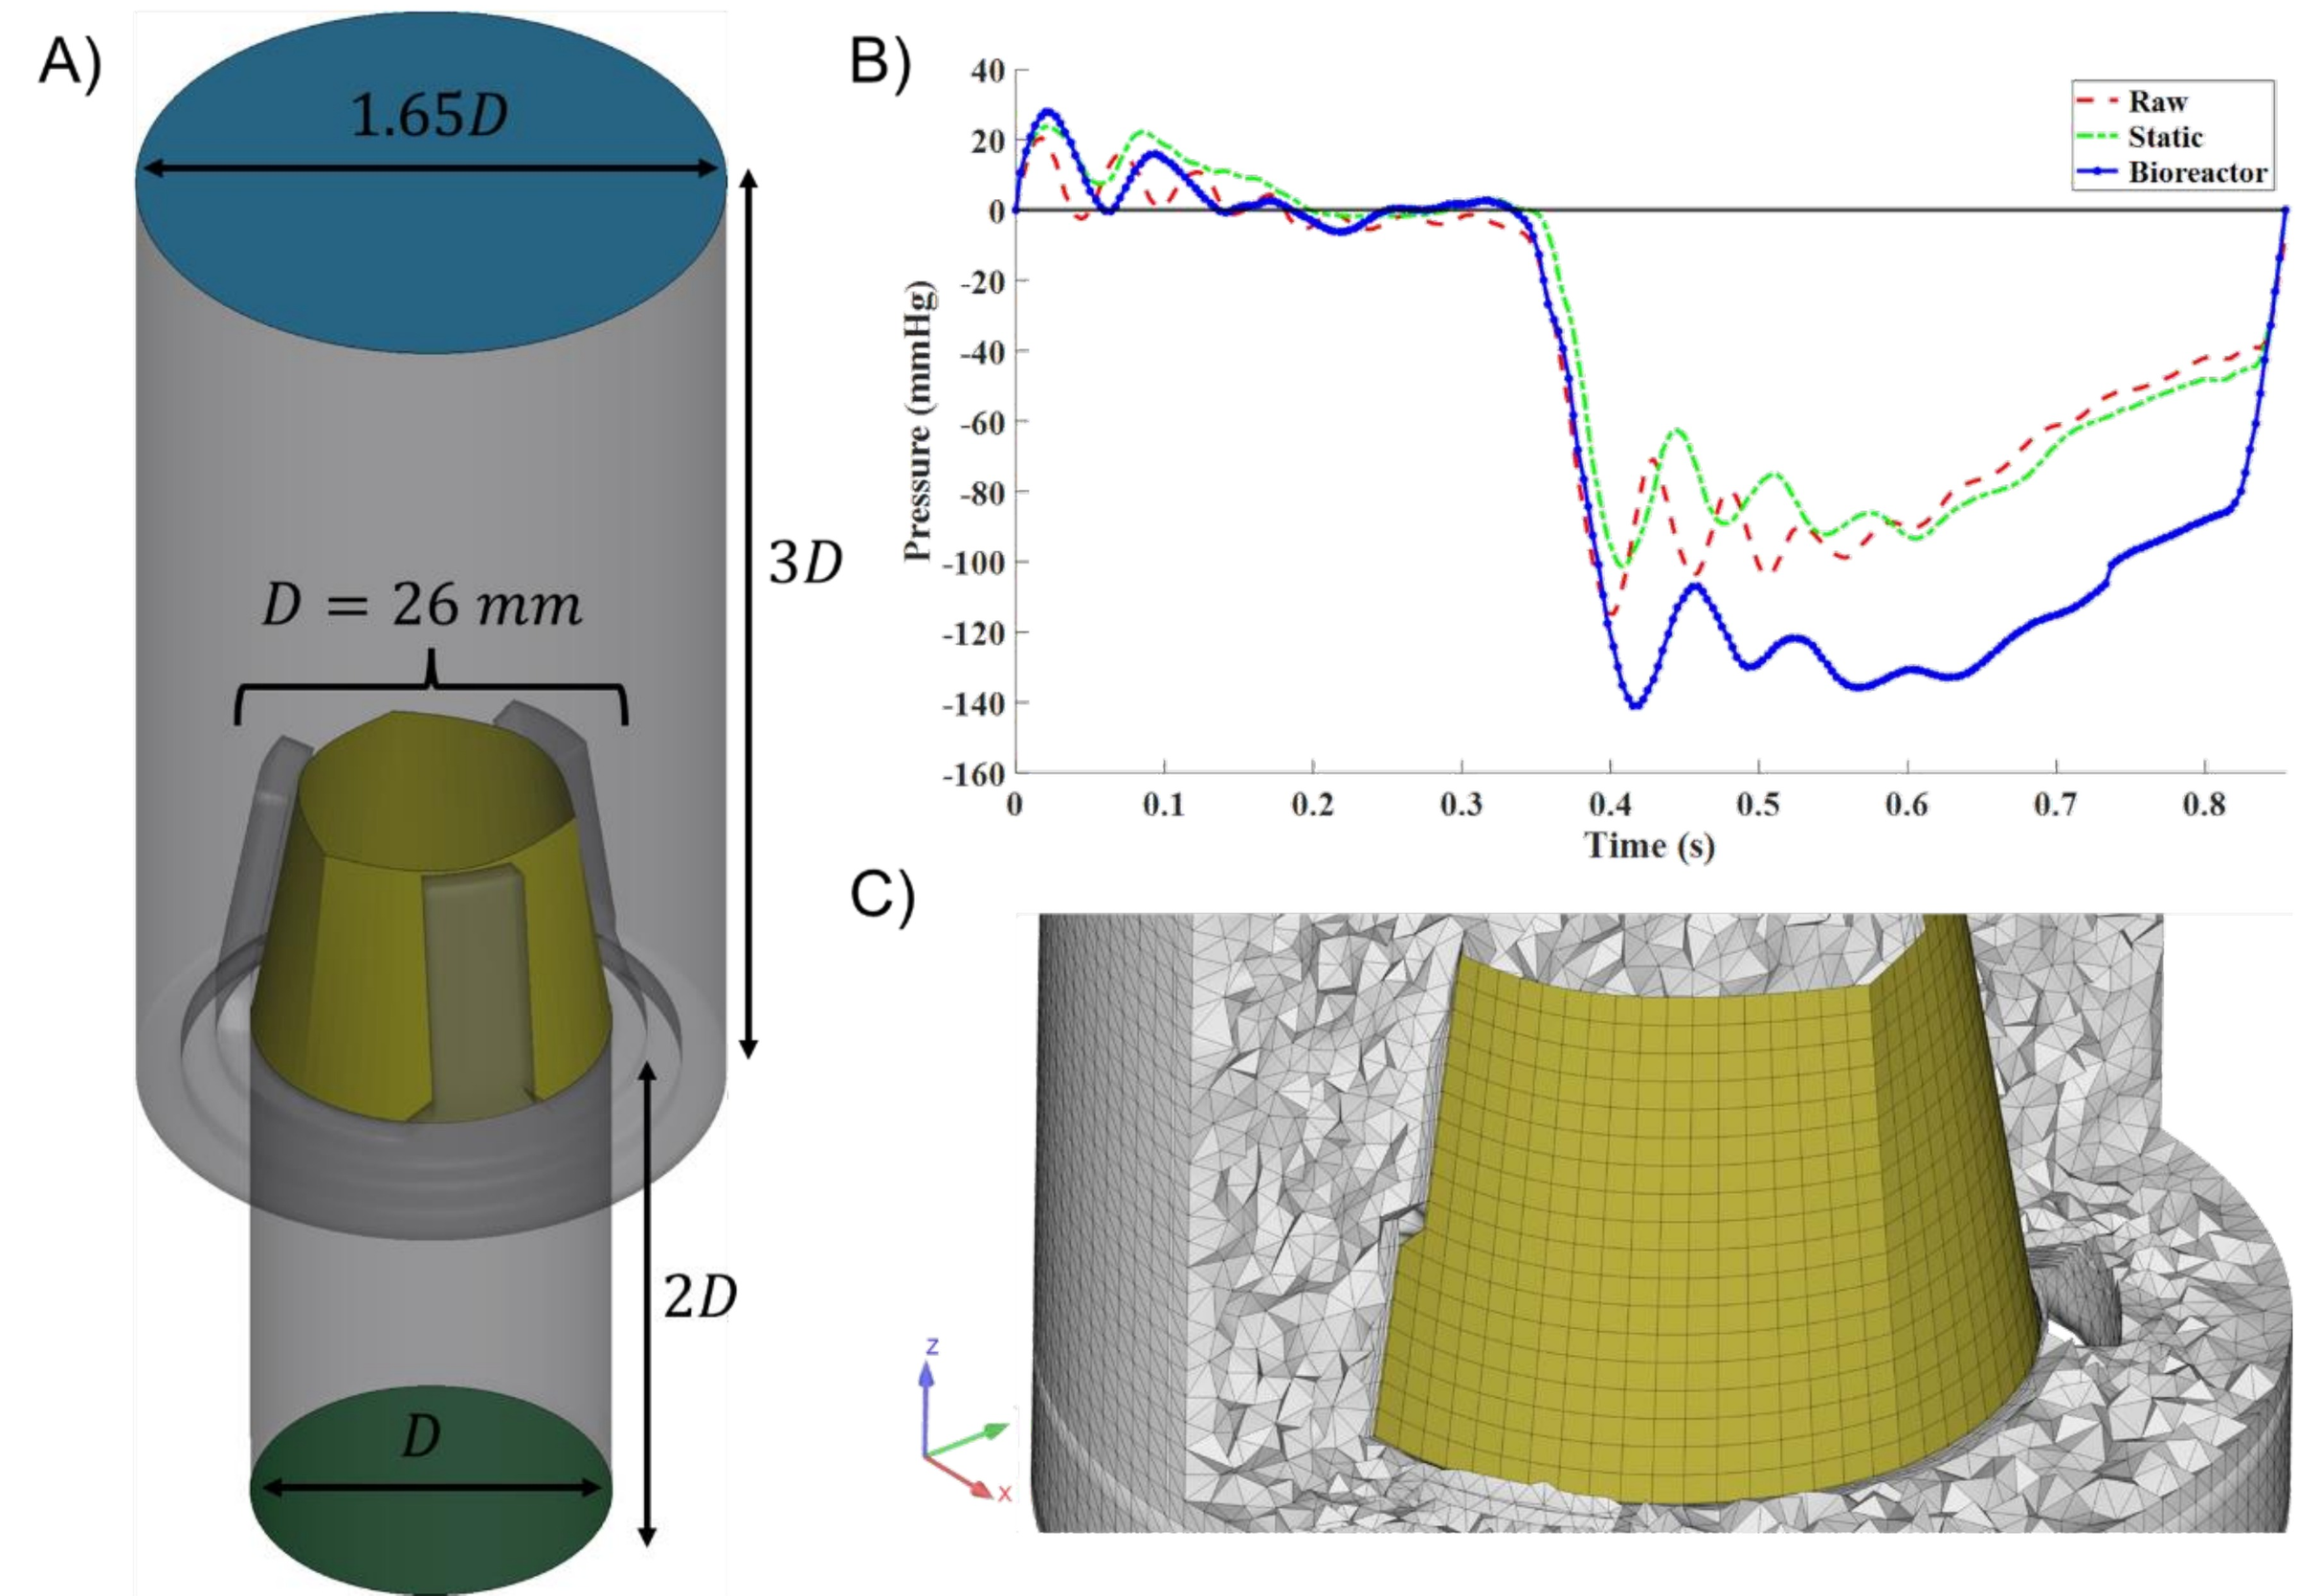
Figure 5-2. Computational model information. (A) Aortic conduit and PSIS scaffold with dimensions scaled to valve diameter D. (B) Inlet pressure differential boundary conditions for Raw (red), Static (green), and Bioreactor (blue) groups. (C) Cross-sectional mesh view with boundary layers inflated along the scaffold.
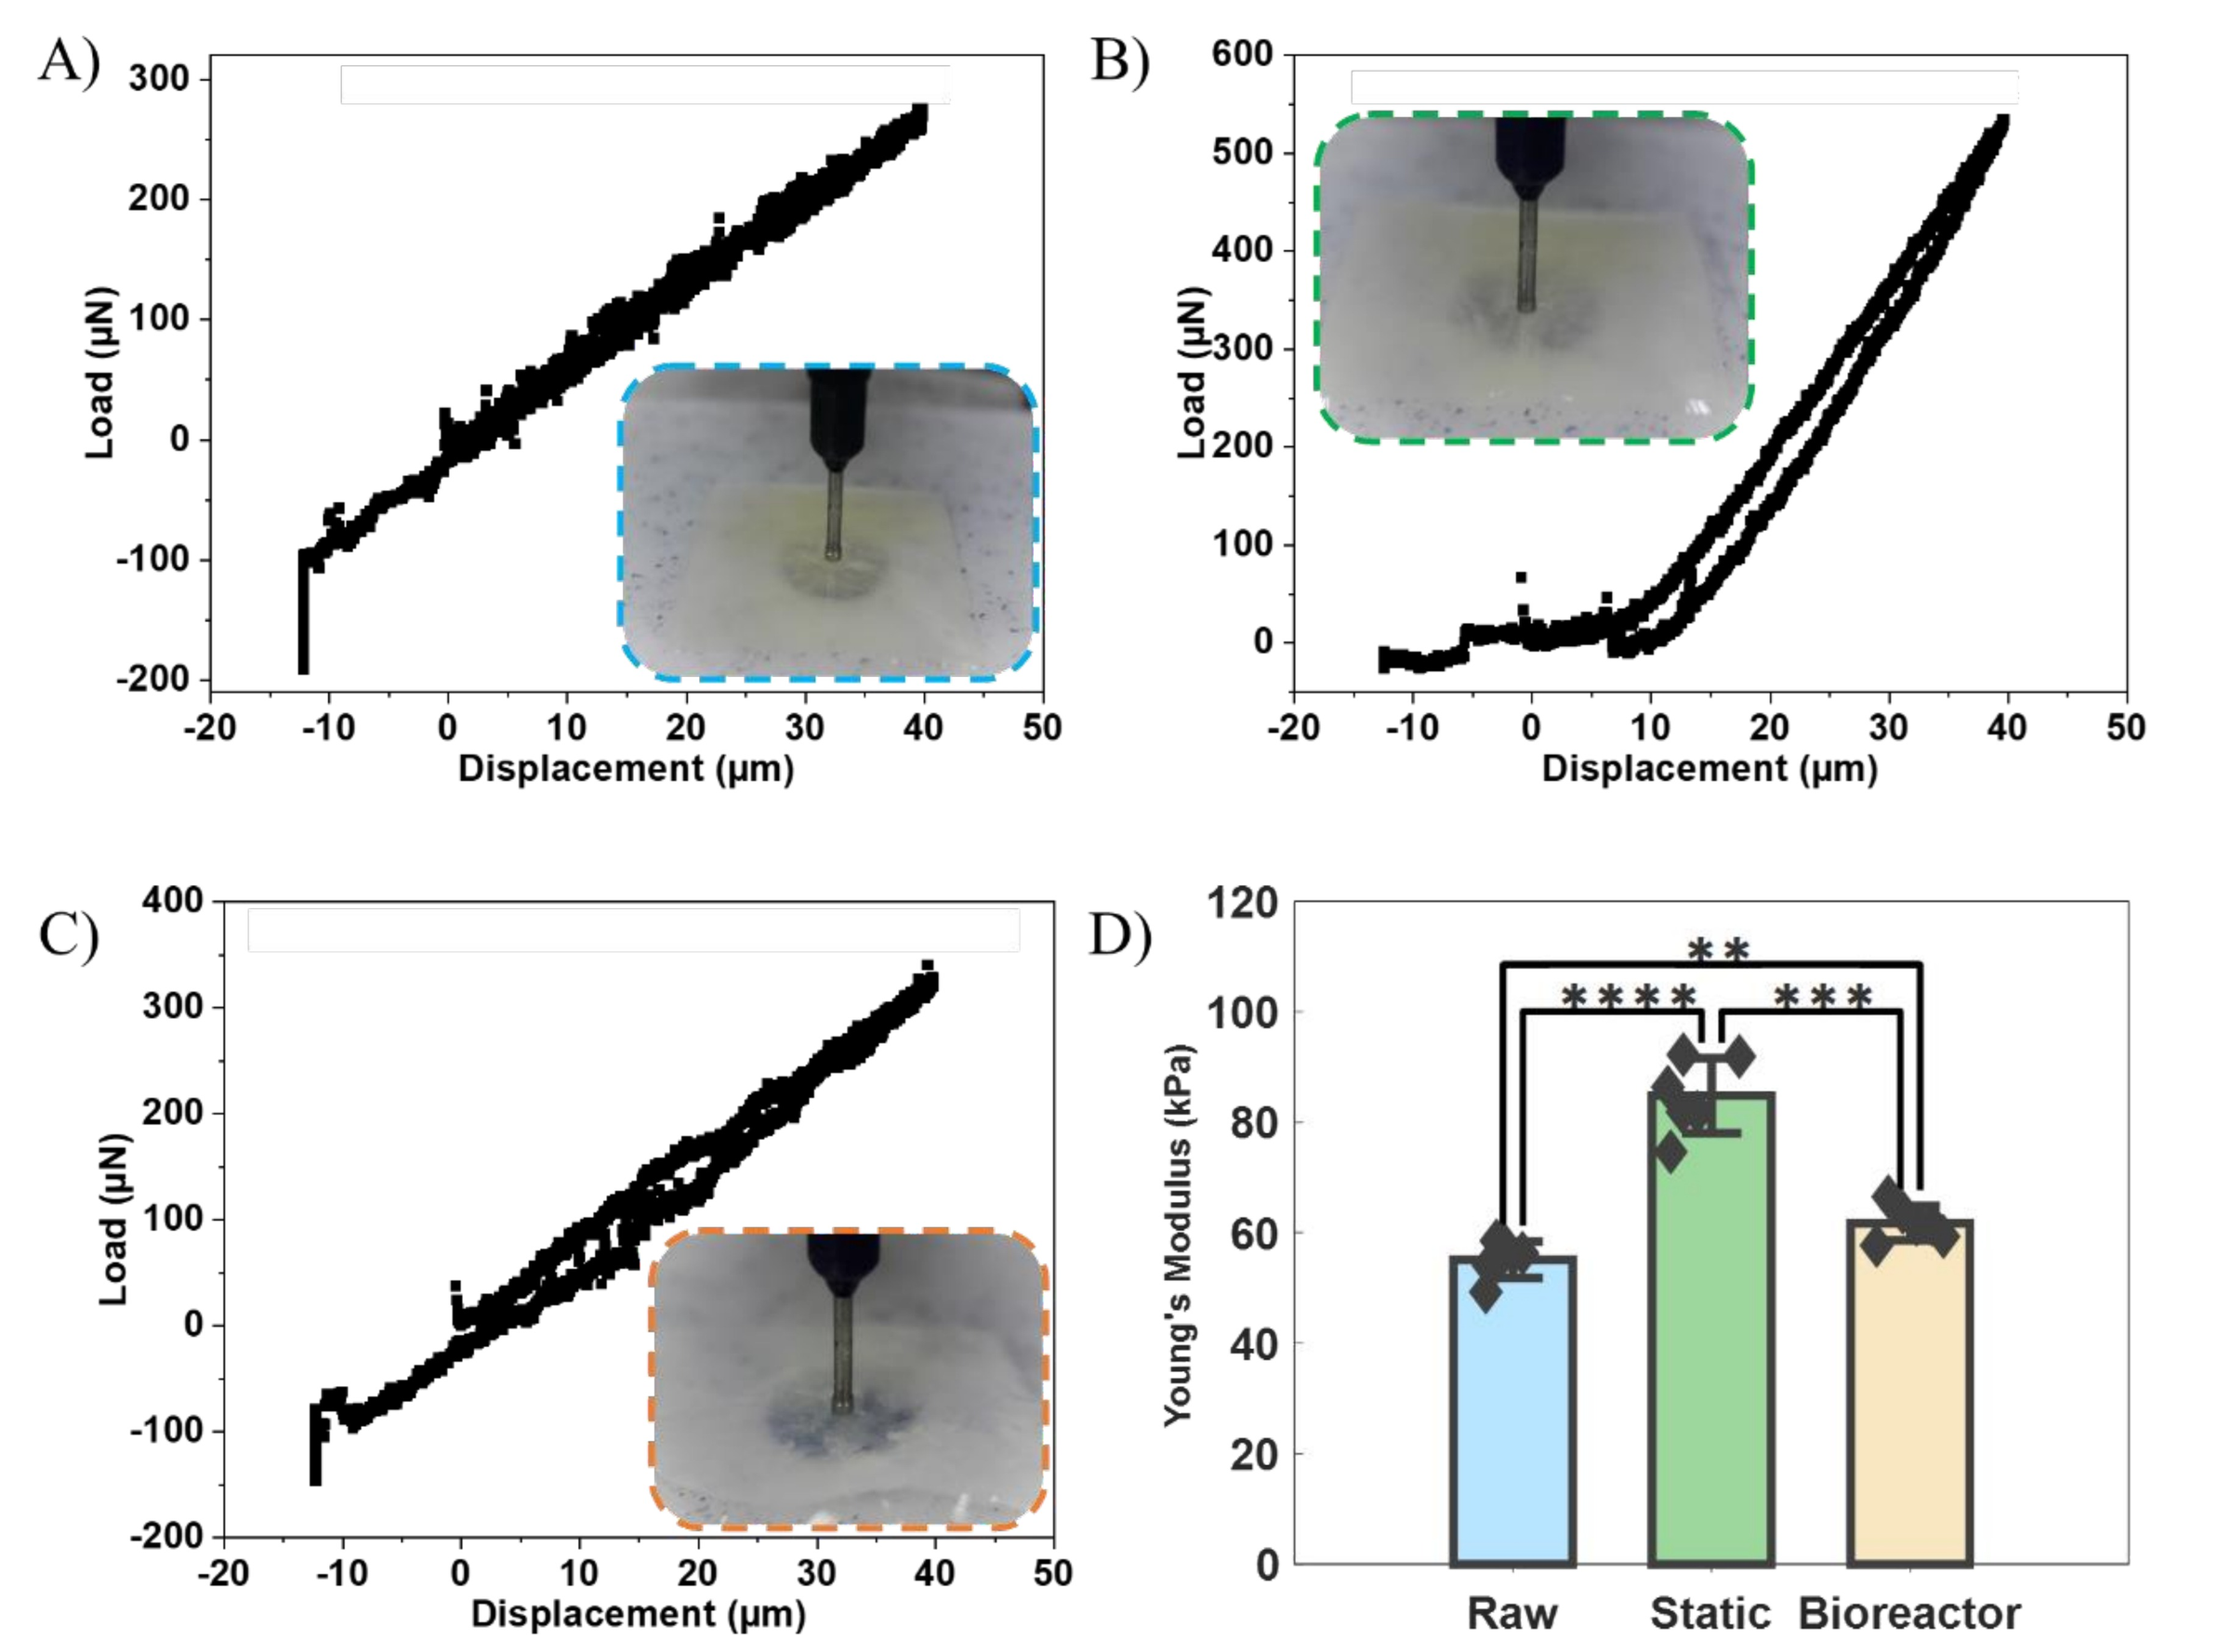
Figure 5-3. Vivitro Pulse Duplicator hydrodynamic results. RF, ΔP, Qrms, and EOA show no statistically significant differences across groups (n.s. = p>0.05), confirming early-stage CAVD is hemodynamically silent.
Figure 5-4. Nanoindentation results. (A–C) Load vs. displacement curves for Raw, Static, and Bioreactor groups. (D) Young's modulus — both calcified groups are significantly stiffer than Raw (** p<0.01, *** p<0.001, **** p<0.0001).
The Alizarin Red staining confirmed calcification in Groups B and C but not Group A. The Vivitro Pulse Duplicator system (70 bpm, 100 mmHg mean arterial pressure, 35% systolic fraction) verified that all valves functioned similarly at the macro hydrodynamic level. FSI simulations used a three-parameter incompressible Mooney-Rivlin hyperelastic model for valve leaflets and a variational multiscale turbulence model for the saline fluid domain (Re ≈ 9,800).
CH. 6
Mouse Aortic Valve Model — Coronary Cusp Calcification Discrepancy
Core Aim 2
In human CAVD, the non-coronary cusp (NCC) consistently shows greater calcification severity than the right coronary cusp (RCC) or left coronary cusp (LCC). Paradoxically, in many mouse models of CAVD, the RCC shows the greatest calcification — the reverse of the human pattern. This discrepancy has limited mouse-to-human translational inference in CAVD research. Understanding why requires interrogating the hemodynamic environment of the mouse coronary ostia — the small openings through which blood enters the coronary arteries.
A parametrized mouse aortic valve model was developed in SolidWorks. The key variable: the right coronary ostium height (ROH) relative to the coaptation point. In mice, this distance varies considerably compared to humans. The hypothesis: when ROH is below the coaptation point, blood actively perfuses through the RCC region, generating higher shear rates and protective hemodynamics on the RCC. When ROH exceeds the coaptation point, the RCC's hemodynamic environment mirrors the NCC — low-shear, oscillatory — predisposing it to greater calcification.
Mouse vs. Human
Mice have greater variability in right coronary ostium height relative to the coaptation point compared to humans. This anatomical variability, not an intrinsic species difference, drives the reversed calcification pattern.
Mechanism
When the right ostium height exceeds the coaptation point, blood perfusion through the RCC region is reduced — causing RCC hemodynamics to resemble the NCC (low shear, high OSI) rather than showing the protective high-shear pattern typical of coronary-side cusps in humans.
Translational Impact
This computational finding offers a mechanistic explanation for why mouse CAVD models cannot be assumed to replicate human calcification patterns — and suggests controlling coronary ostium geometry when selecting or engineering mouse models for valve research.
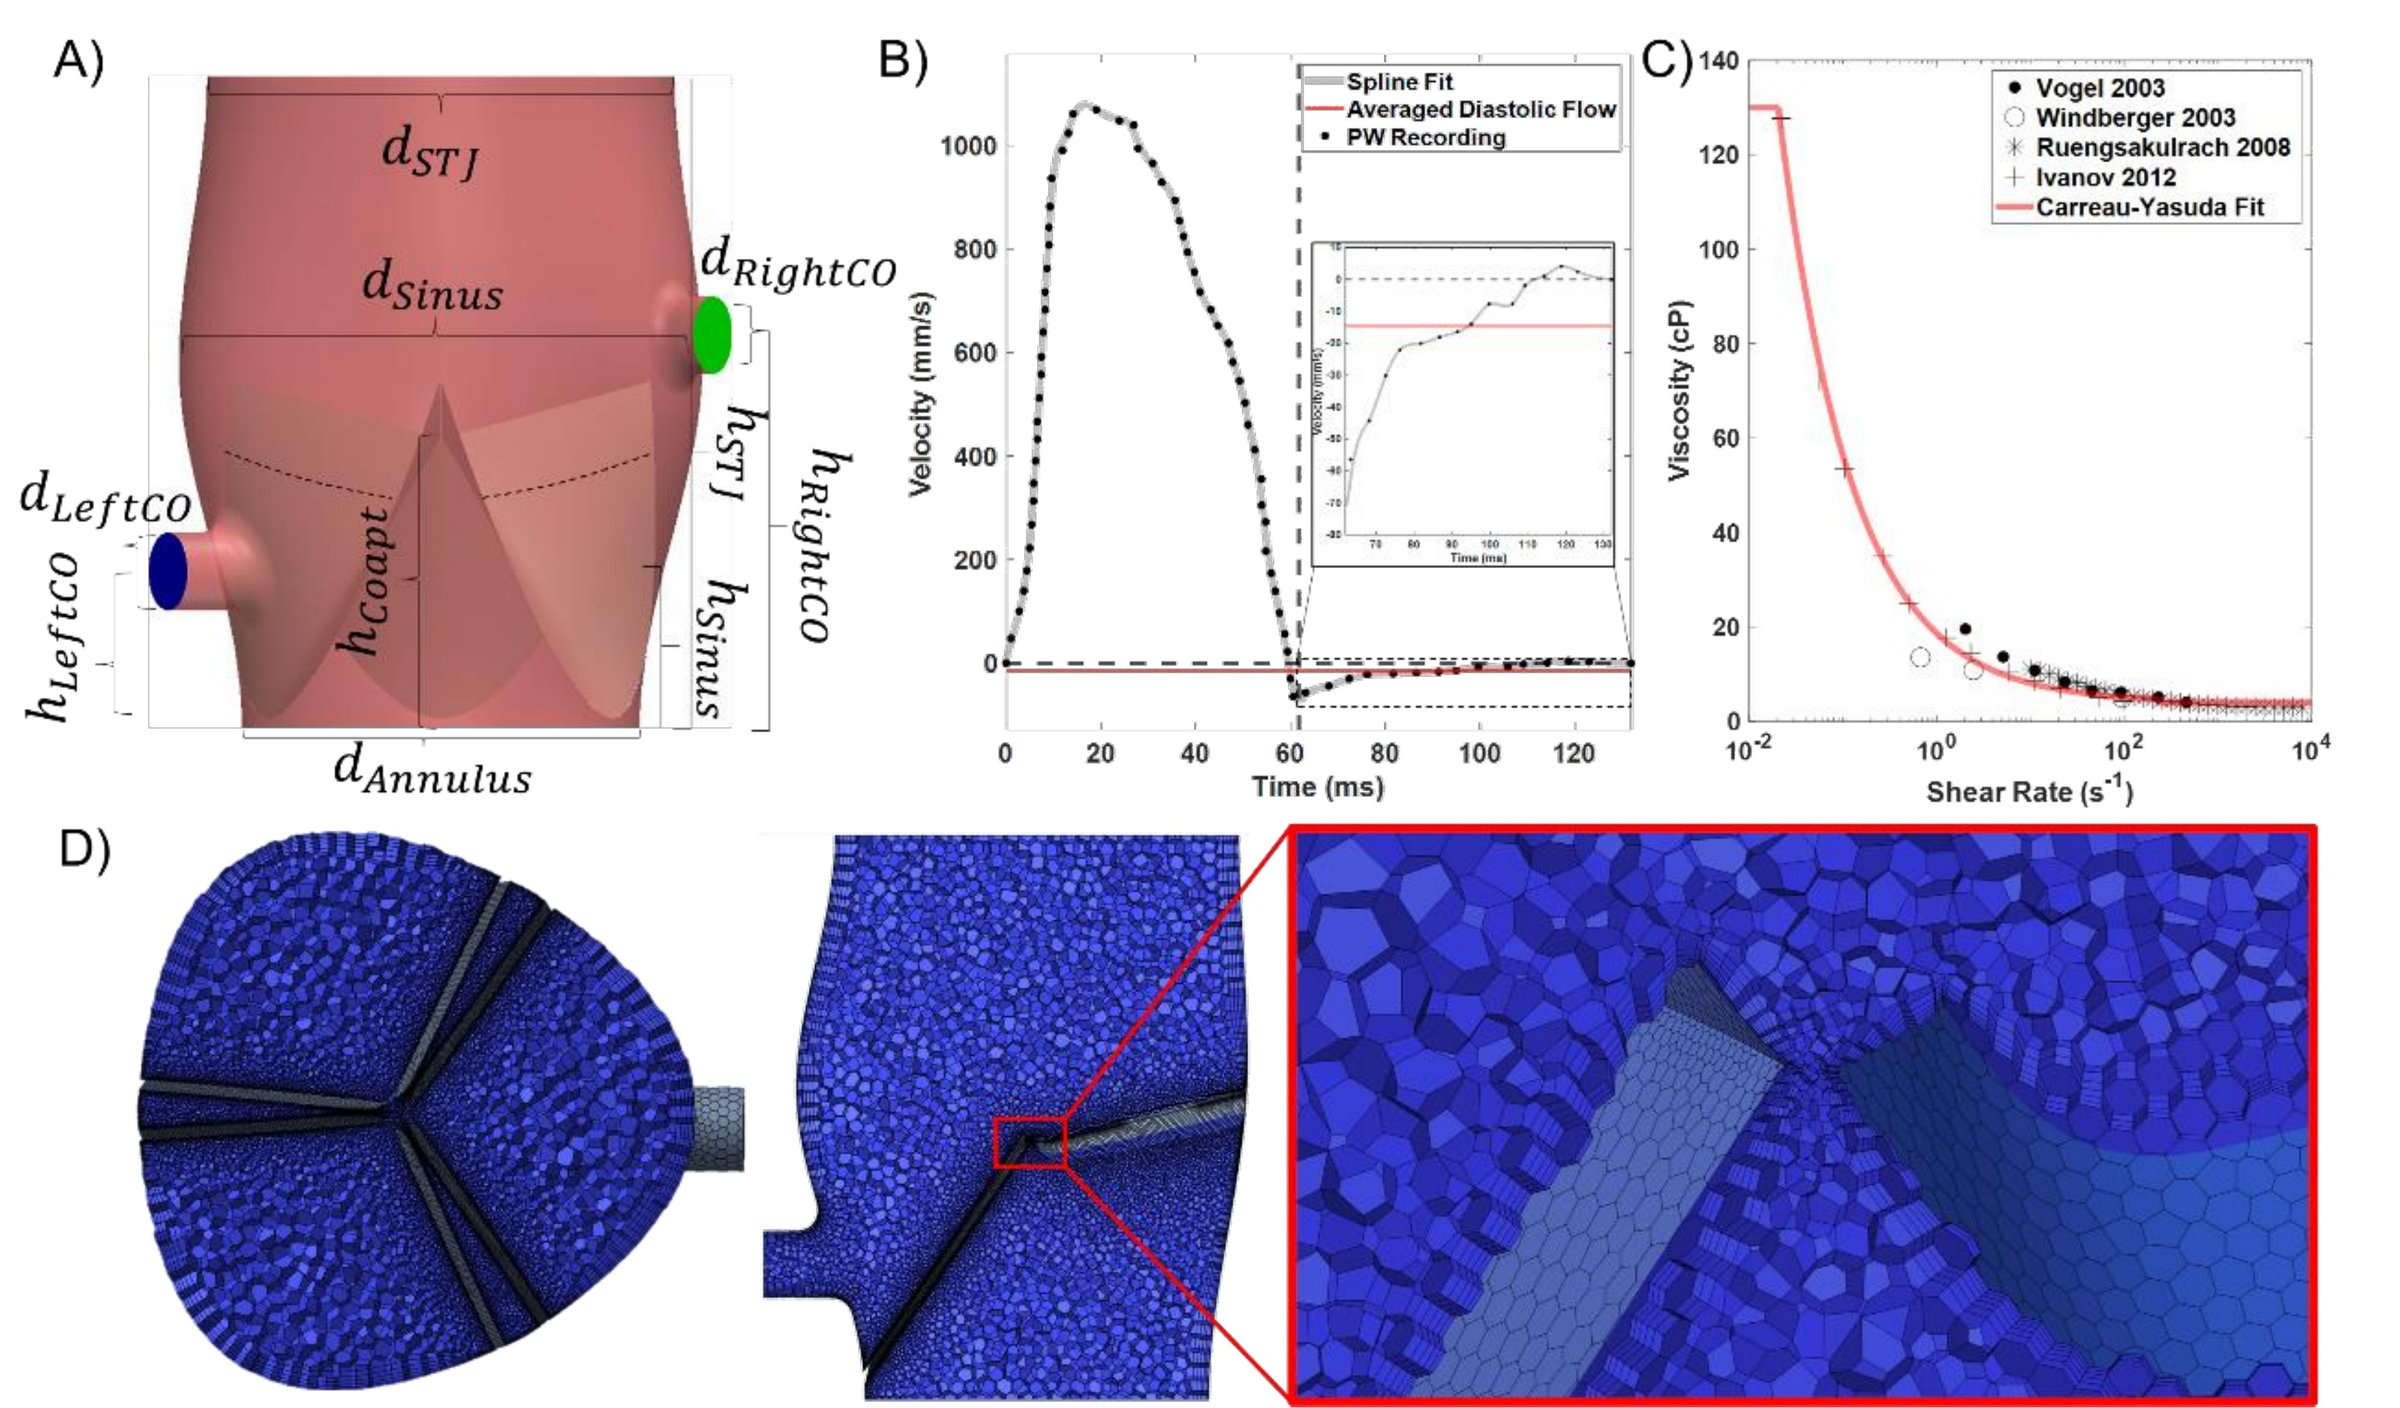
Figure 6-1. Mouse aortic valve model components. (A) Parametrized CAD with annotated geometric parameters and hRightCO variable. (B) Inlet diastolic velocity waveform from pulsed-wave Doppler. (C) Murine Carreau-Yasuda viscosity fit. (D) Polyhedral mesh with boundary layers at the coaptation point.
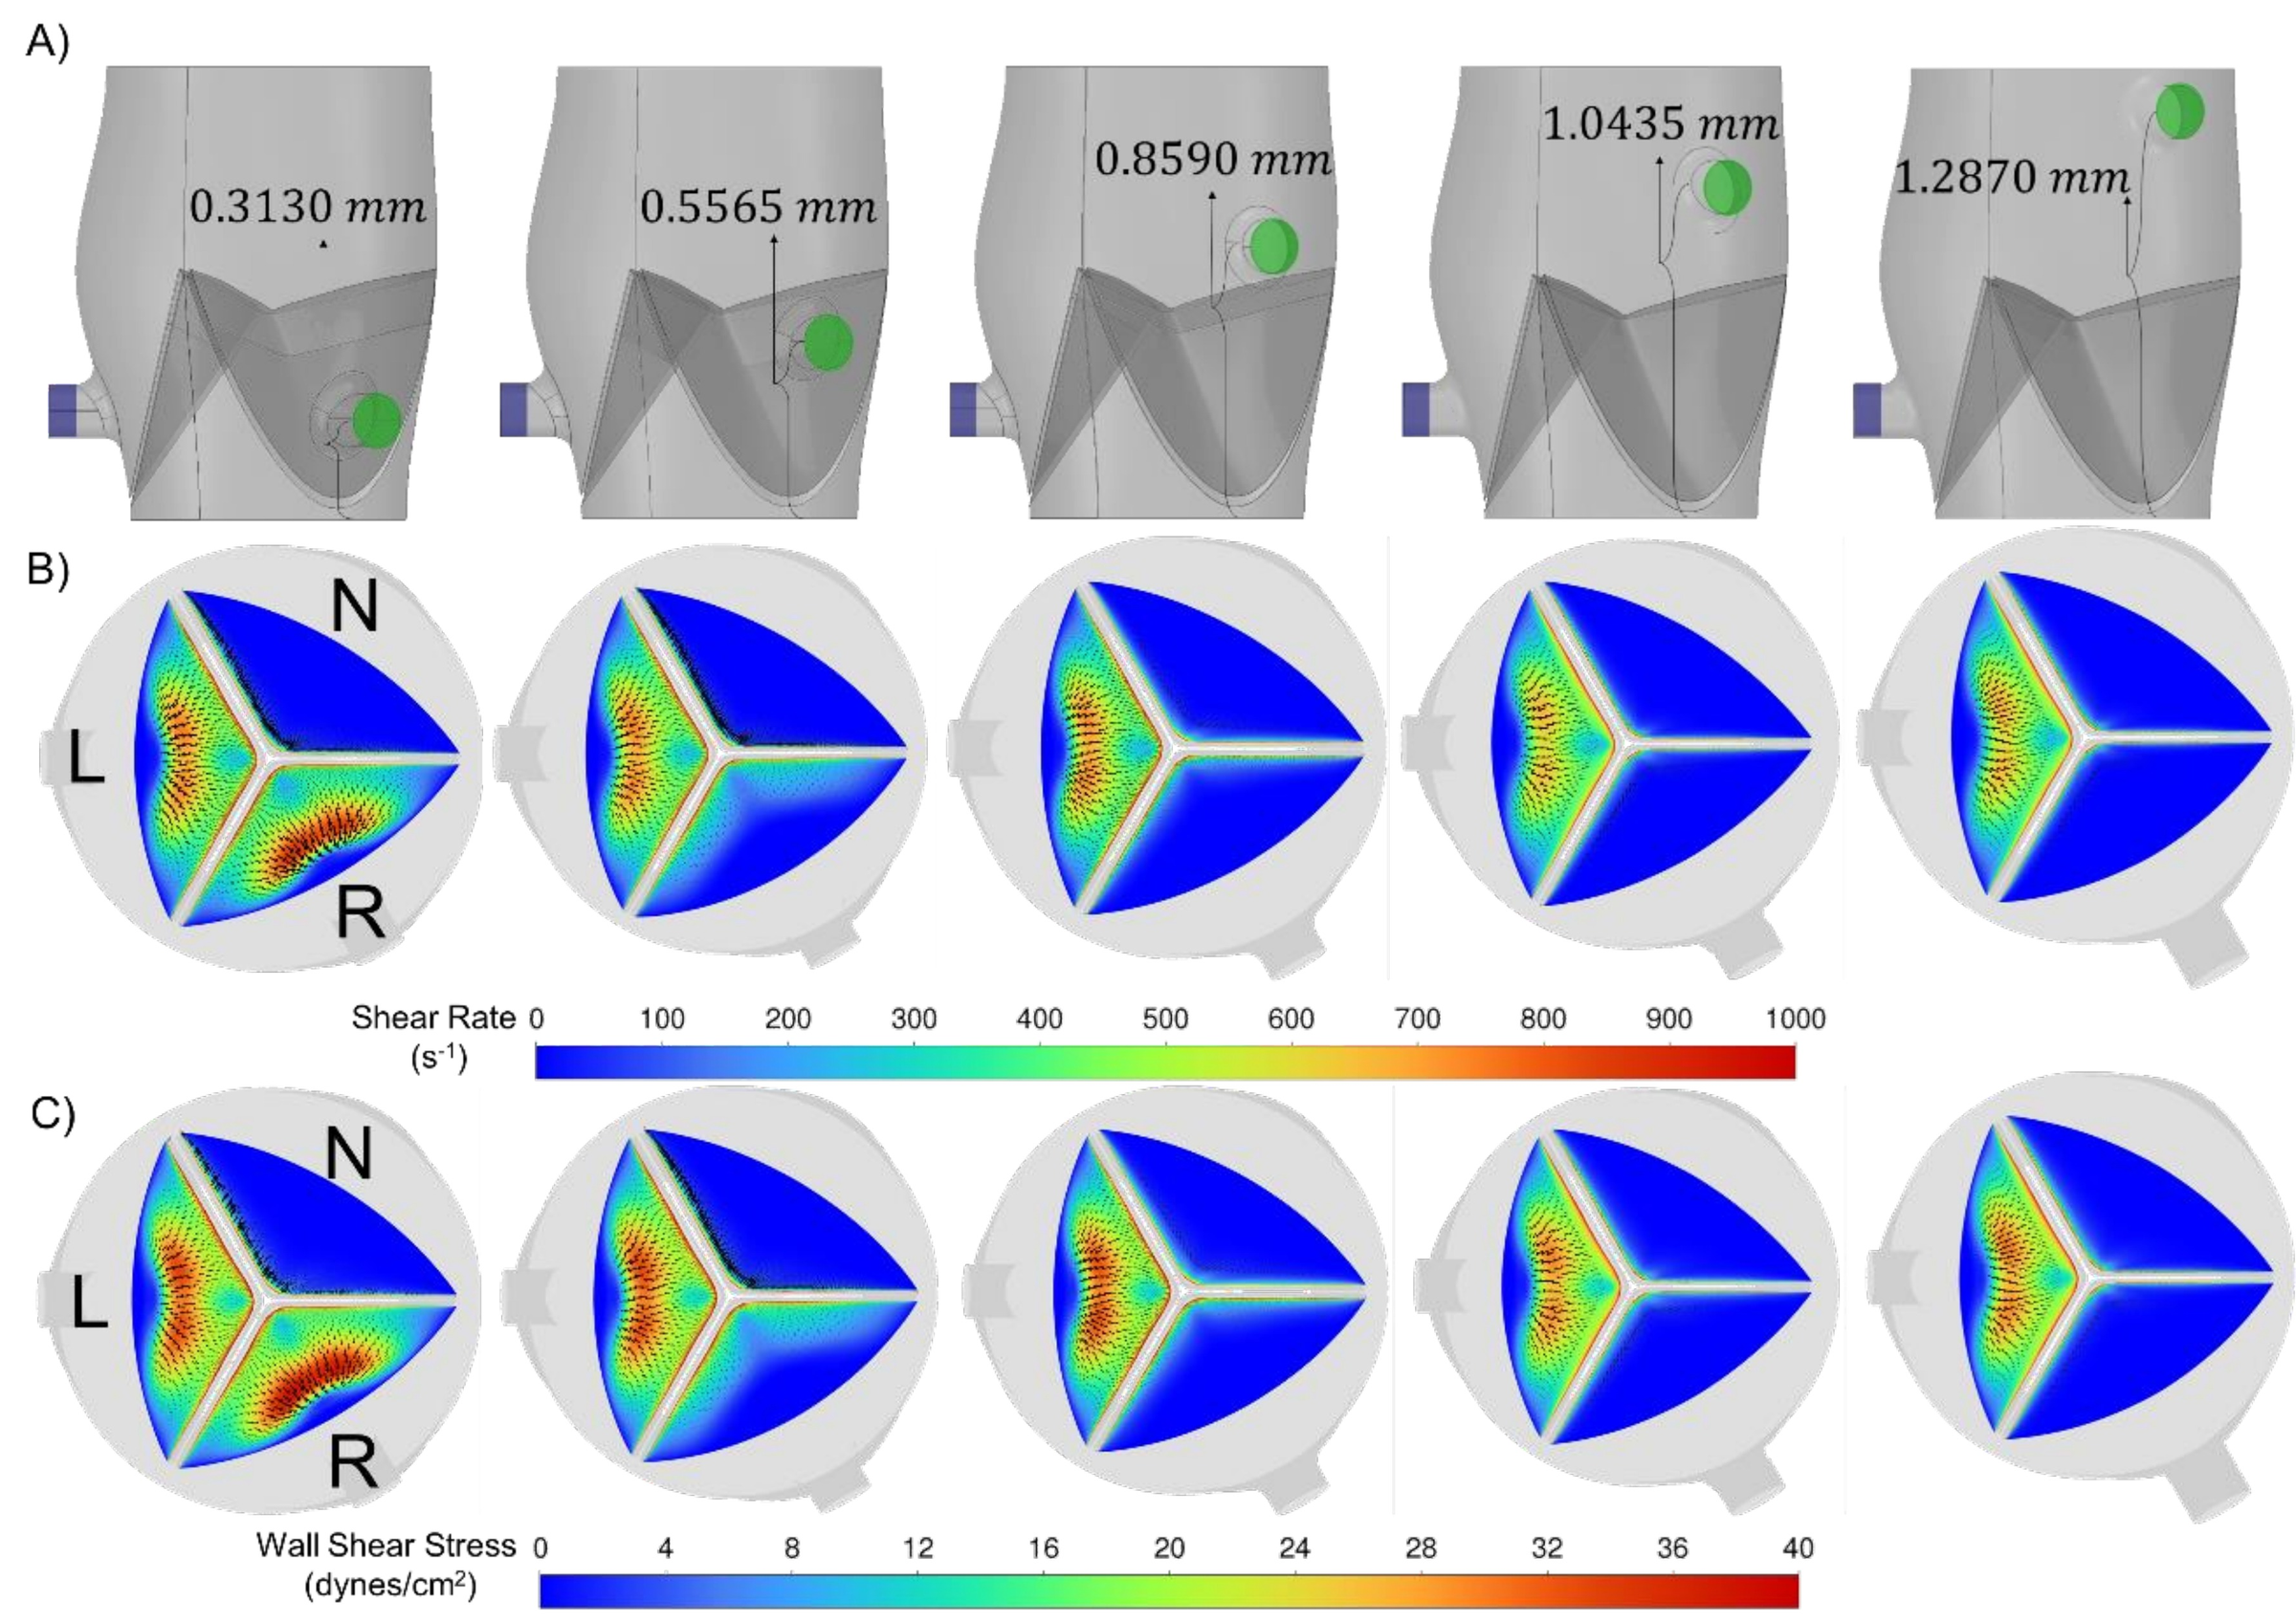
Figure 6-2. Right coronary ostium height variation wall metrics. (A) Valve geometries across five hRightCO values. (B) Fibrosa-side shear rate distributions. (C) Fibrosa-side WSS distributions. As hRightCO exceeds the coaptation point, RCC shear converges toward the low-shear NCC pattern.
CH. 7
Parametric Pipeline: Valve Size × CAVD Severity
Core Aim 3 · Published · Bioengineering 2024
The final aim scales the biomarker framework to a clinically representative population by systematically varying both valve annular size (22–30 mm, the full clinical range) and CAVD severity (Grades 1–6). This required two major computational contributions: (1) a parametrized healthy aortic valve model that automatically scales all anatomy to any given annulus diameter, and (2) a Python-based calcification generator running in Blender that programmatically deposits calcific nodules of varying grade onto any leaflet geometry.
Calcification Grading Schema (Bahler et al.)
Grade 1 — NoneNo nodules
Grade 2 — MinimalLocalized deposits, no dense areas
Grade 6 — SevereNodules on all leaflets, both ventricularis and fibrosa surfaces
The calcification generator used Blender's metaball objects (non-mesh clay-like forms that merge organically) to place nodules along leaflet free edges and belly regions, then converted and remeshed the result with a Perlin noise displacement modifier to eliminate artificial surface regularities — producing morphologically realistic calcific deposits. All deposits were scaled consistently by the annulus diameter (dAnnulus) to ensure cross-size comparability.
50+
Total FSI simulations across all size–grade combinations
4
Valve annular sizes (22, 25, 27, 30 mm)
6
CAVD grades (1–6, None→Severe)
R²>0.85
Validation against ex vivo hydrodynamic data
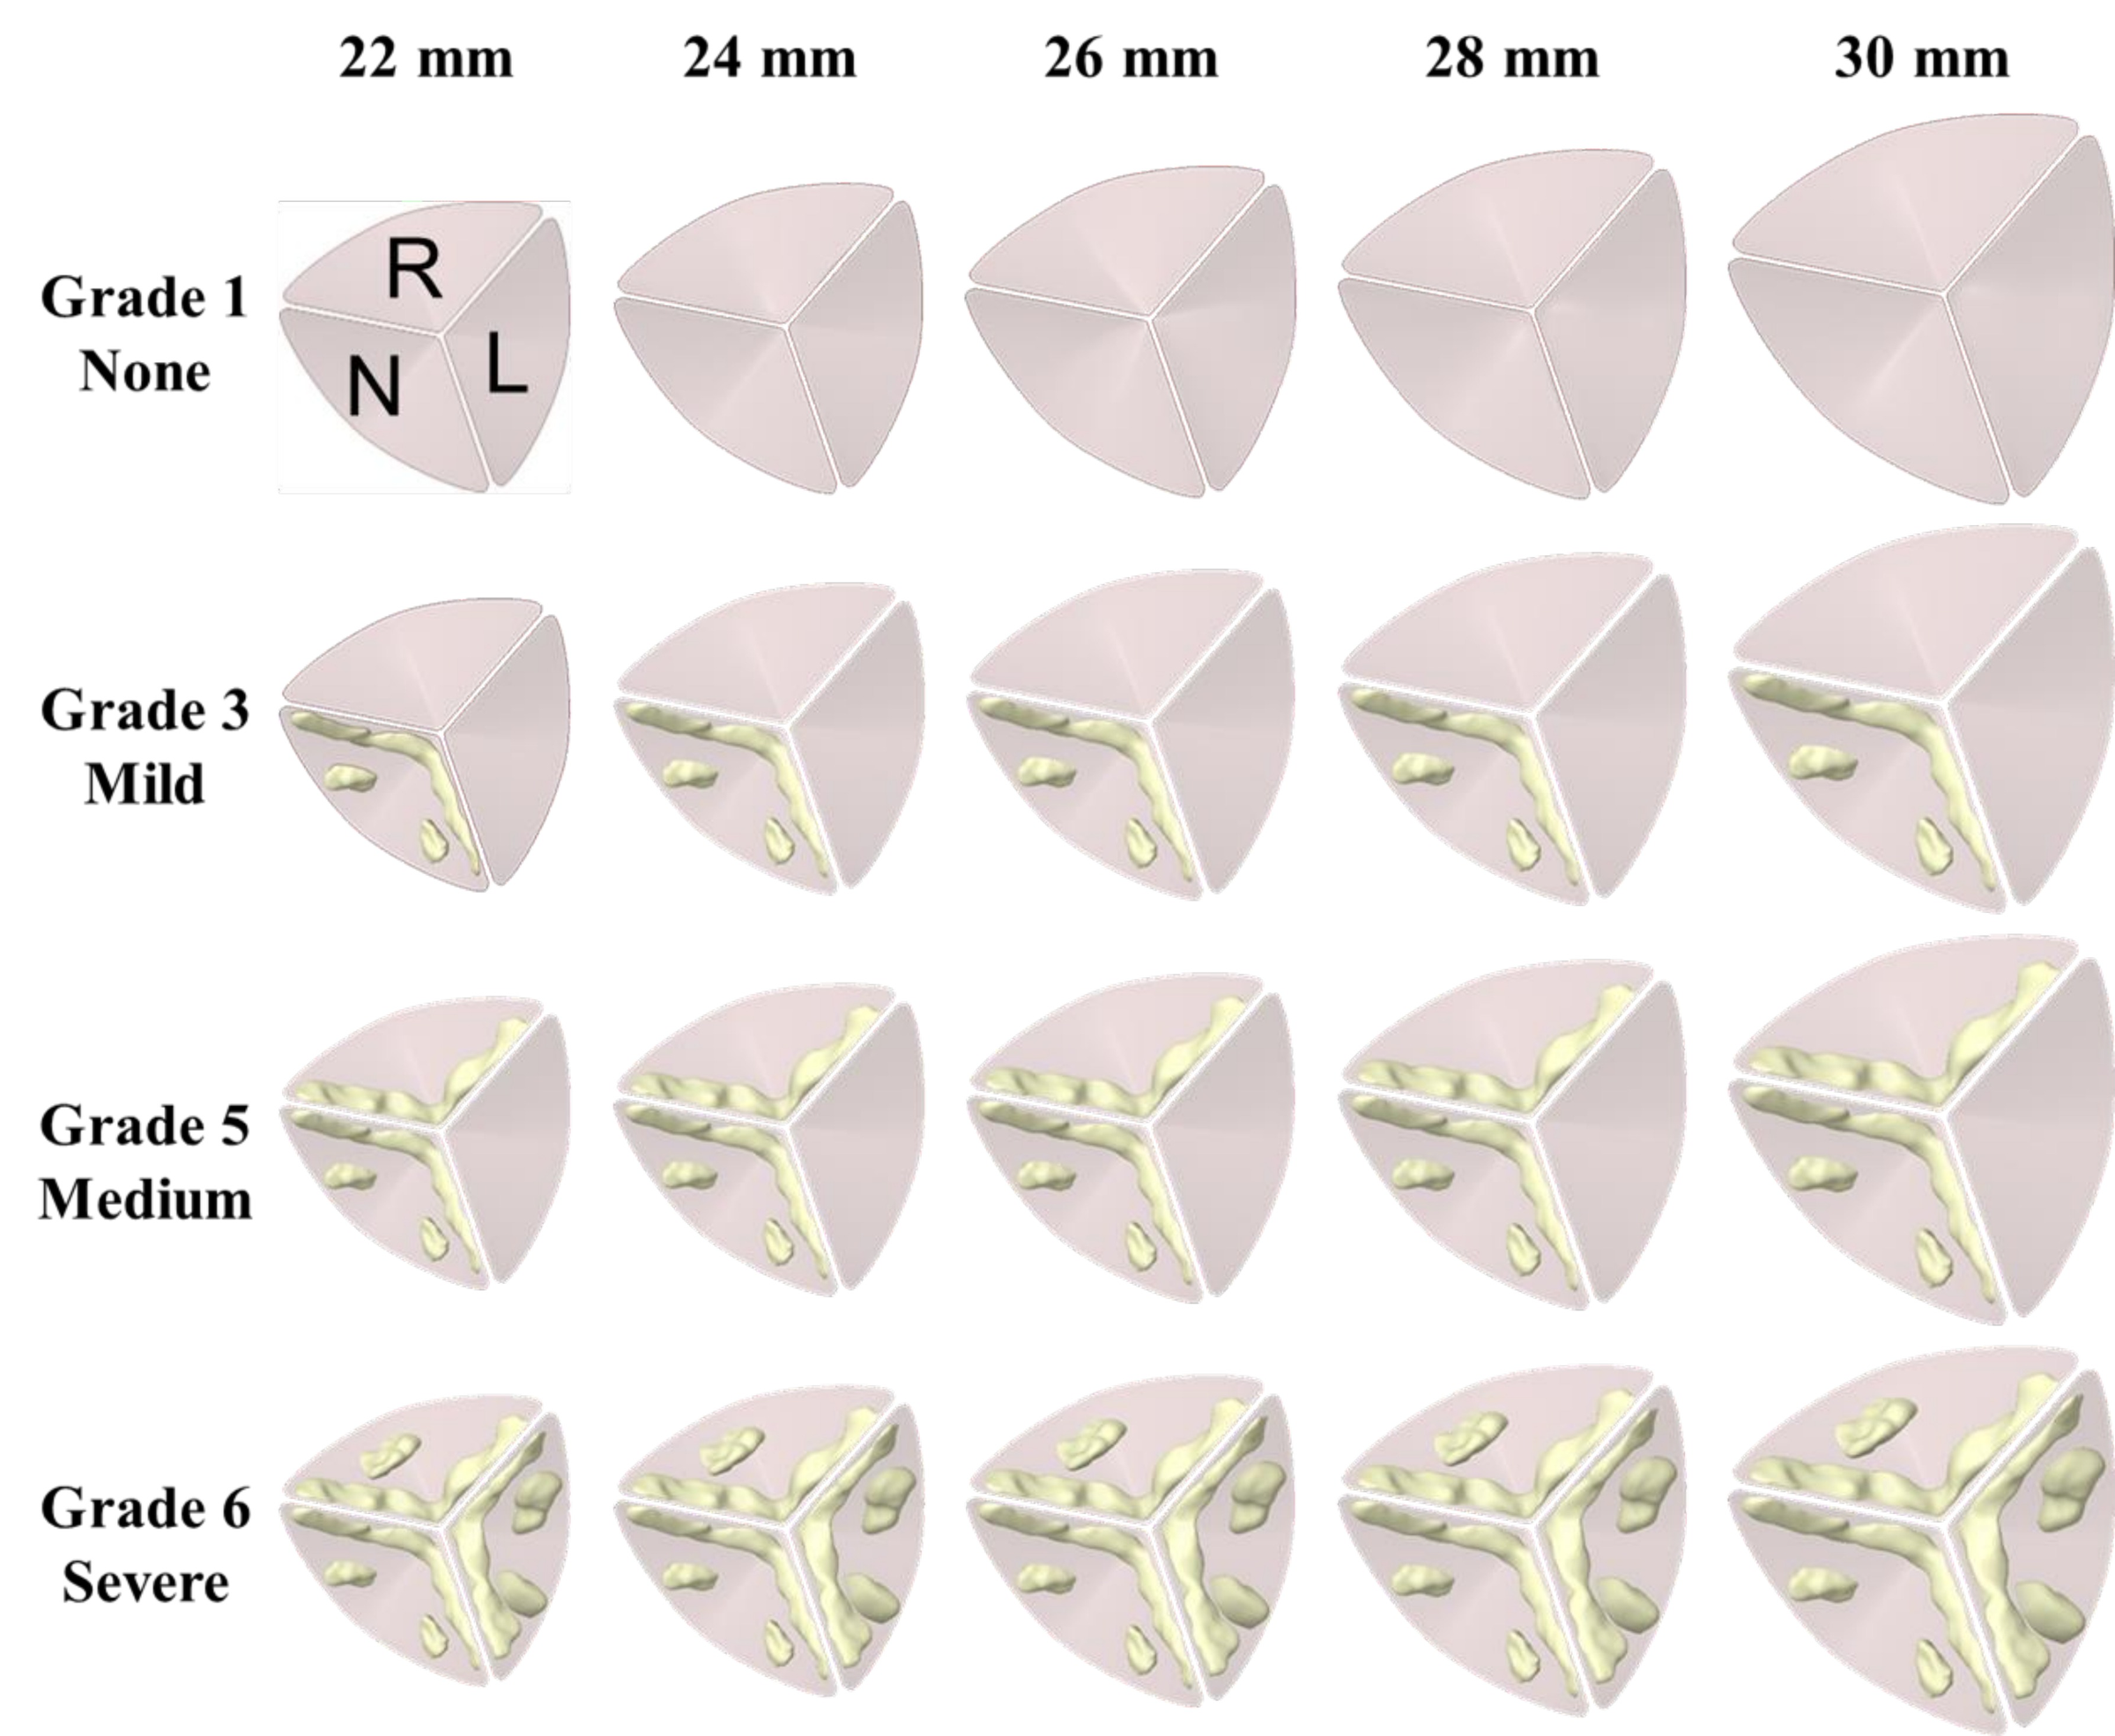
Figure 7-1. Short-axis aortic view of CAVD intensities across grades (1=None, 3=Mild, 5=Medium, 6=Severe) and valve sizes (22–30 mm). Yellow deposits show calcific nodules generated by the Python/Blender calcification algorithm.
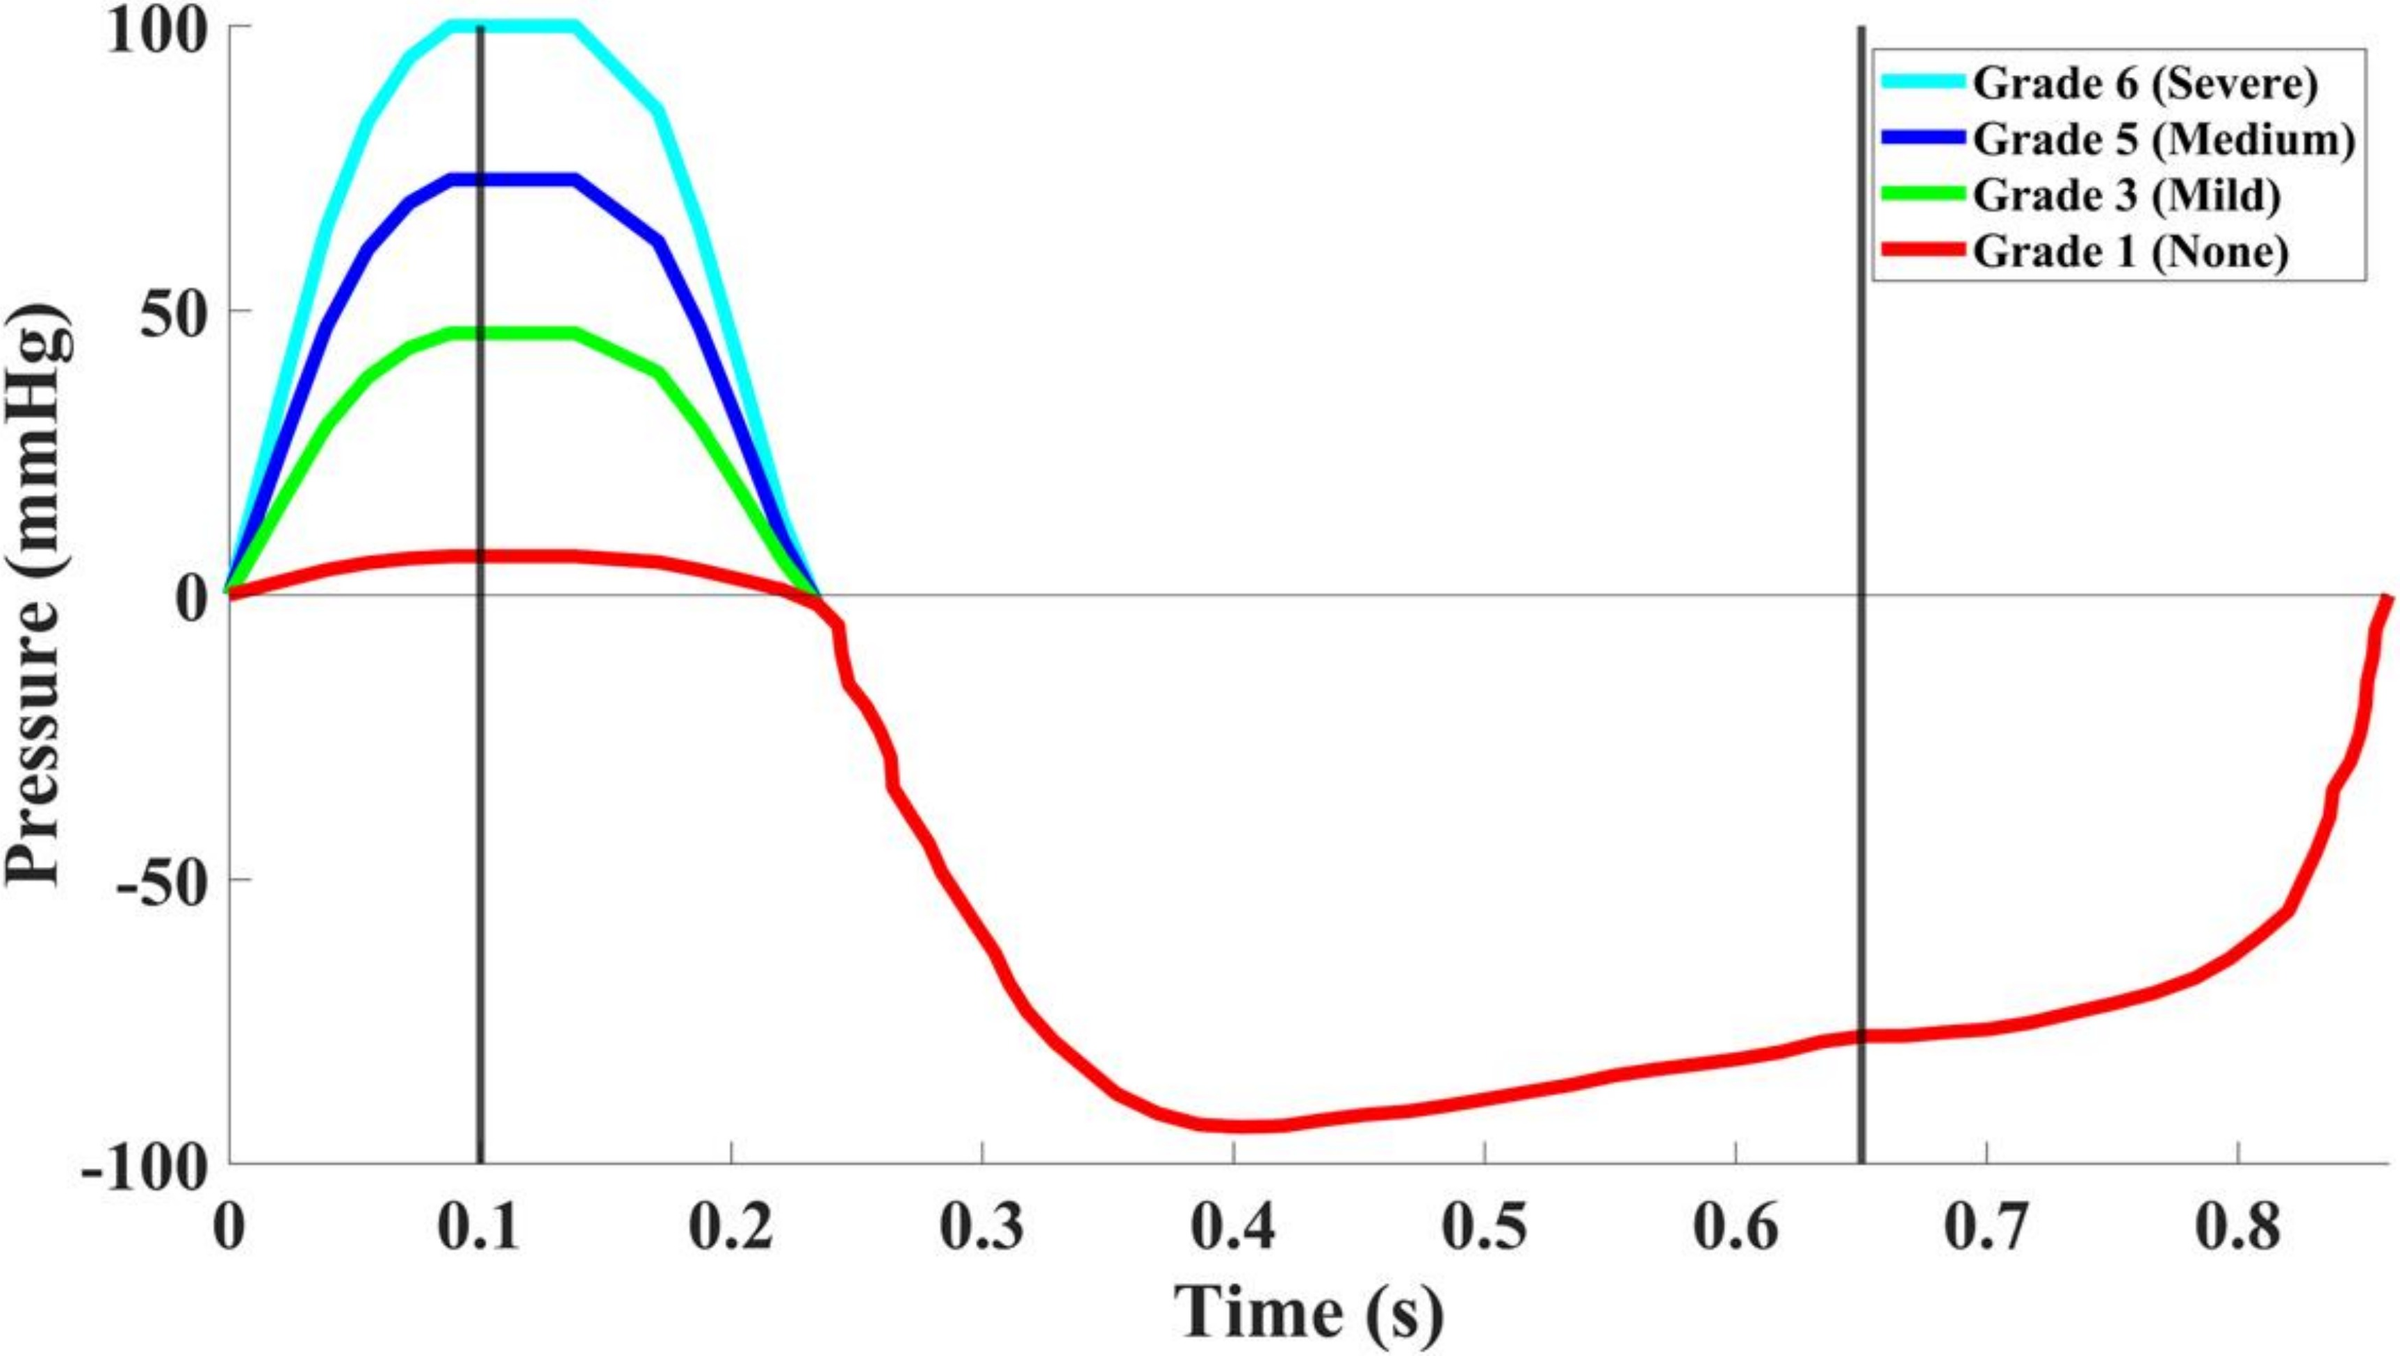
Figure 7-2. Inlet differential pressure boundary conditions per CAVD grade across one cardiac cycle. Higher grades require greater driving pressures, consistent with clinical AS severity thresholds. Vertical lines mark ts=0.10 s and tD=0.65 s.
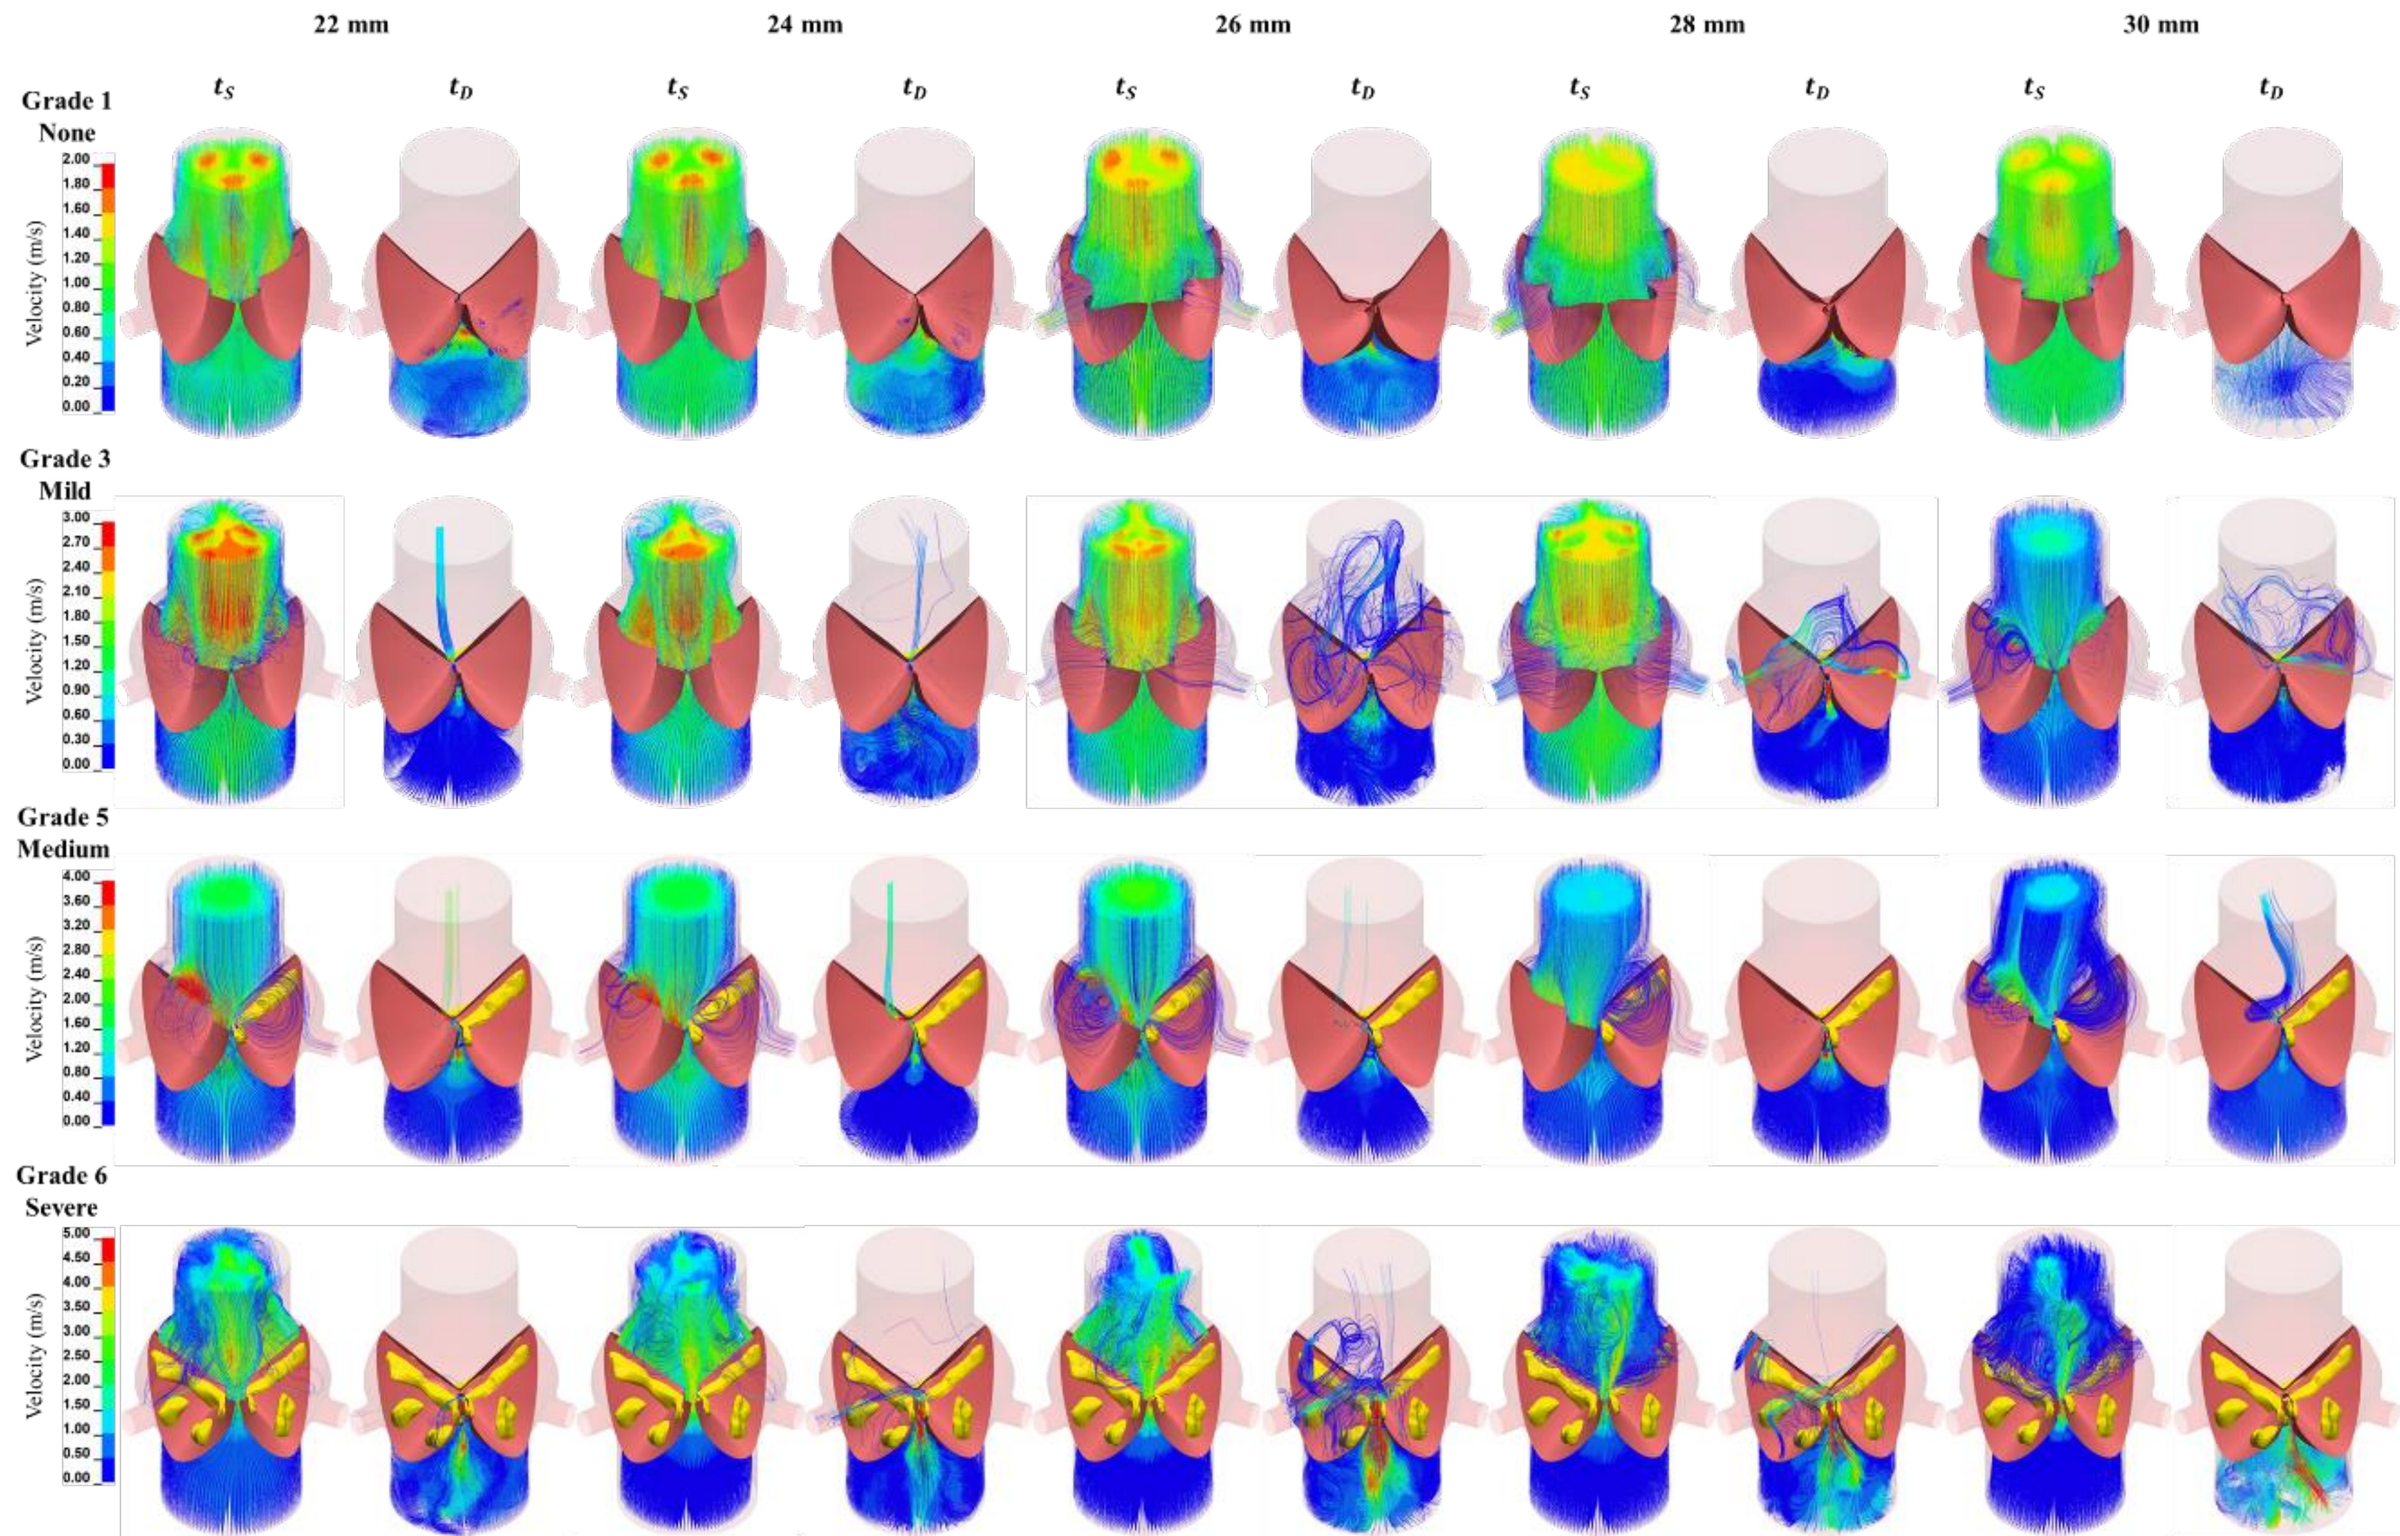
Figure 7-3. Velocity streamlines at peak systole (ts=0.10 s) and peak diastole (tD=0.65 s) across all CAVD grades and valve sizes. Grade 1 shows symmetric outflow; higher grades produce progressively asymmetric jets and regurgitant flow.
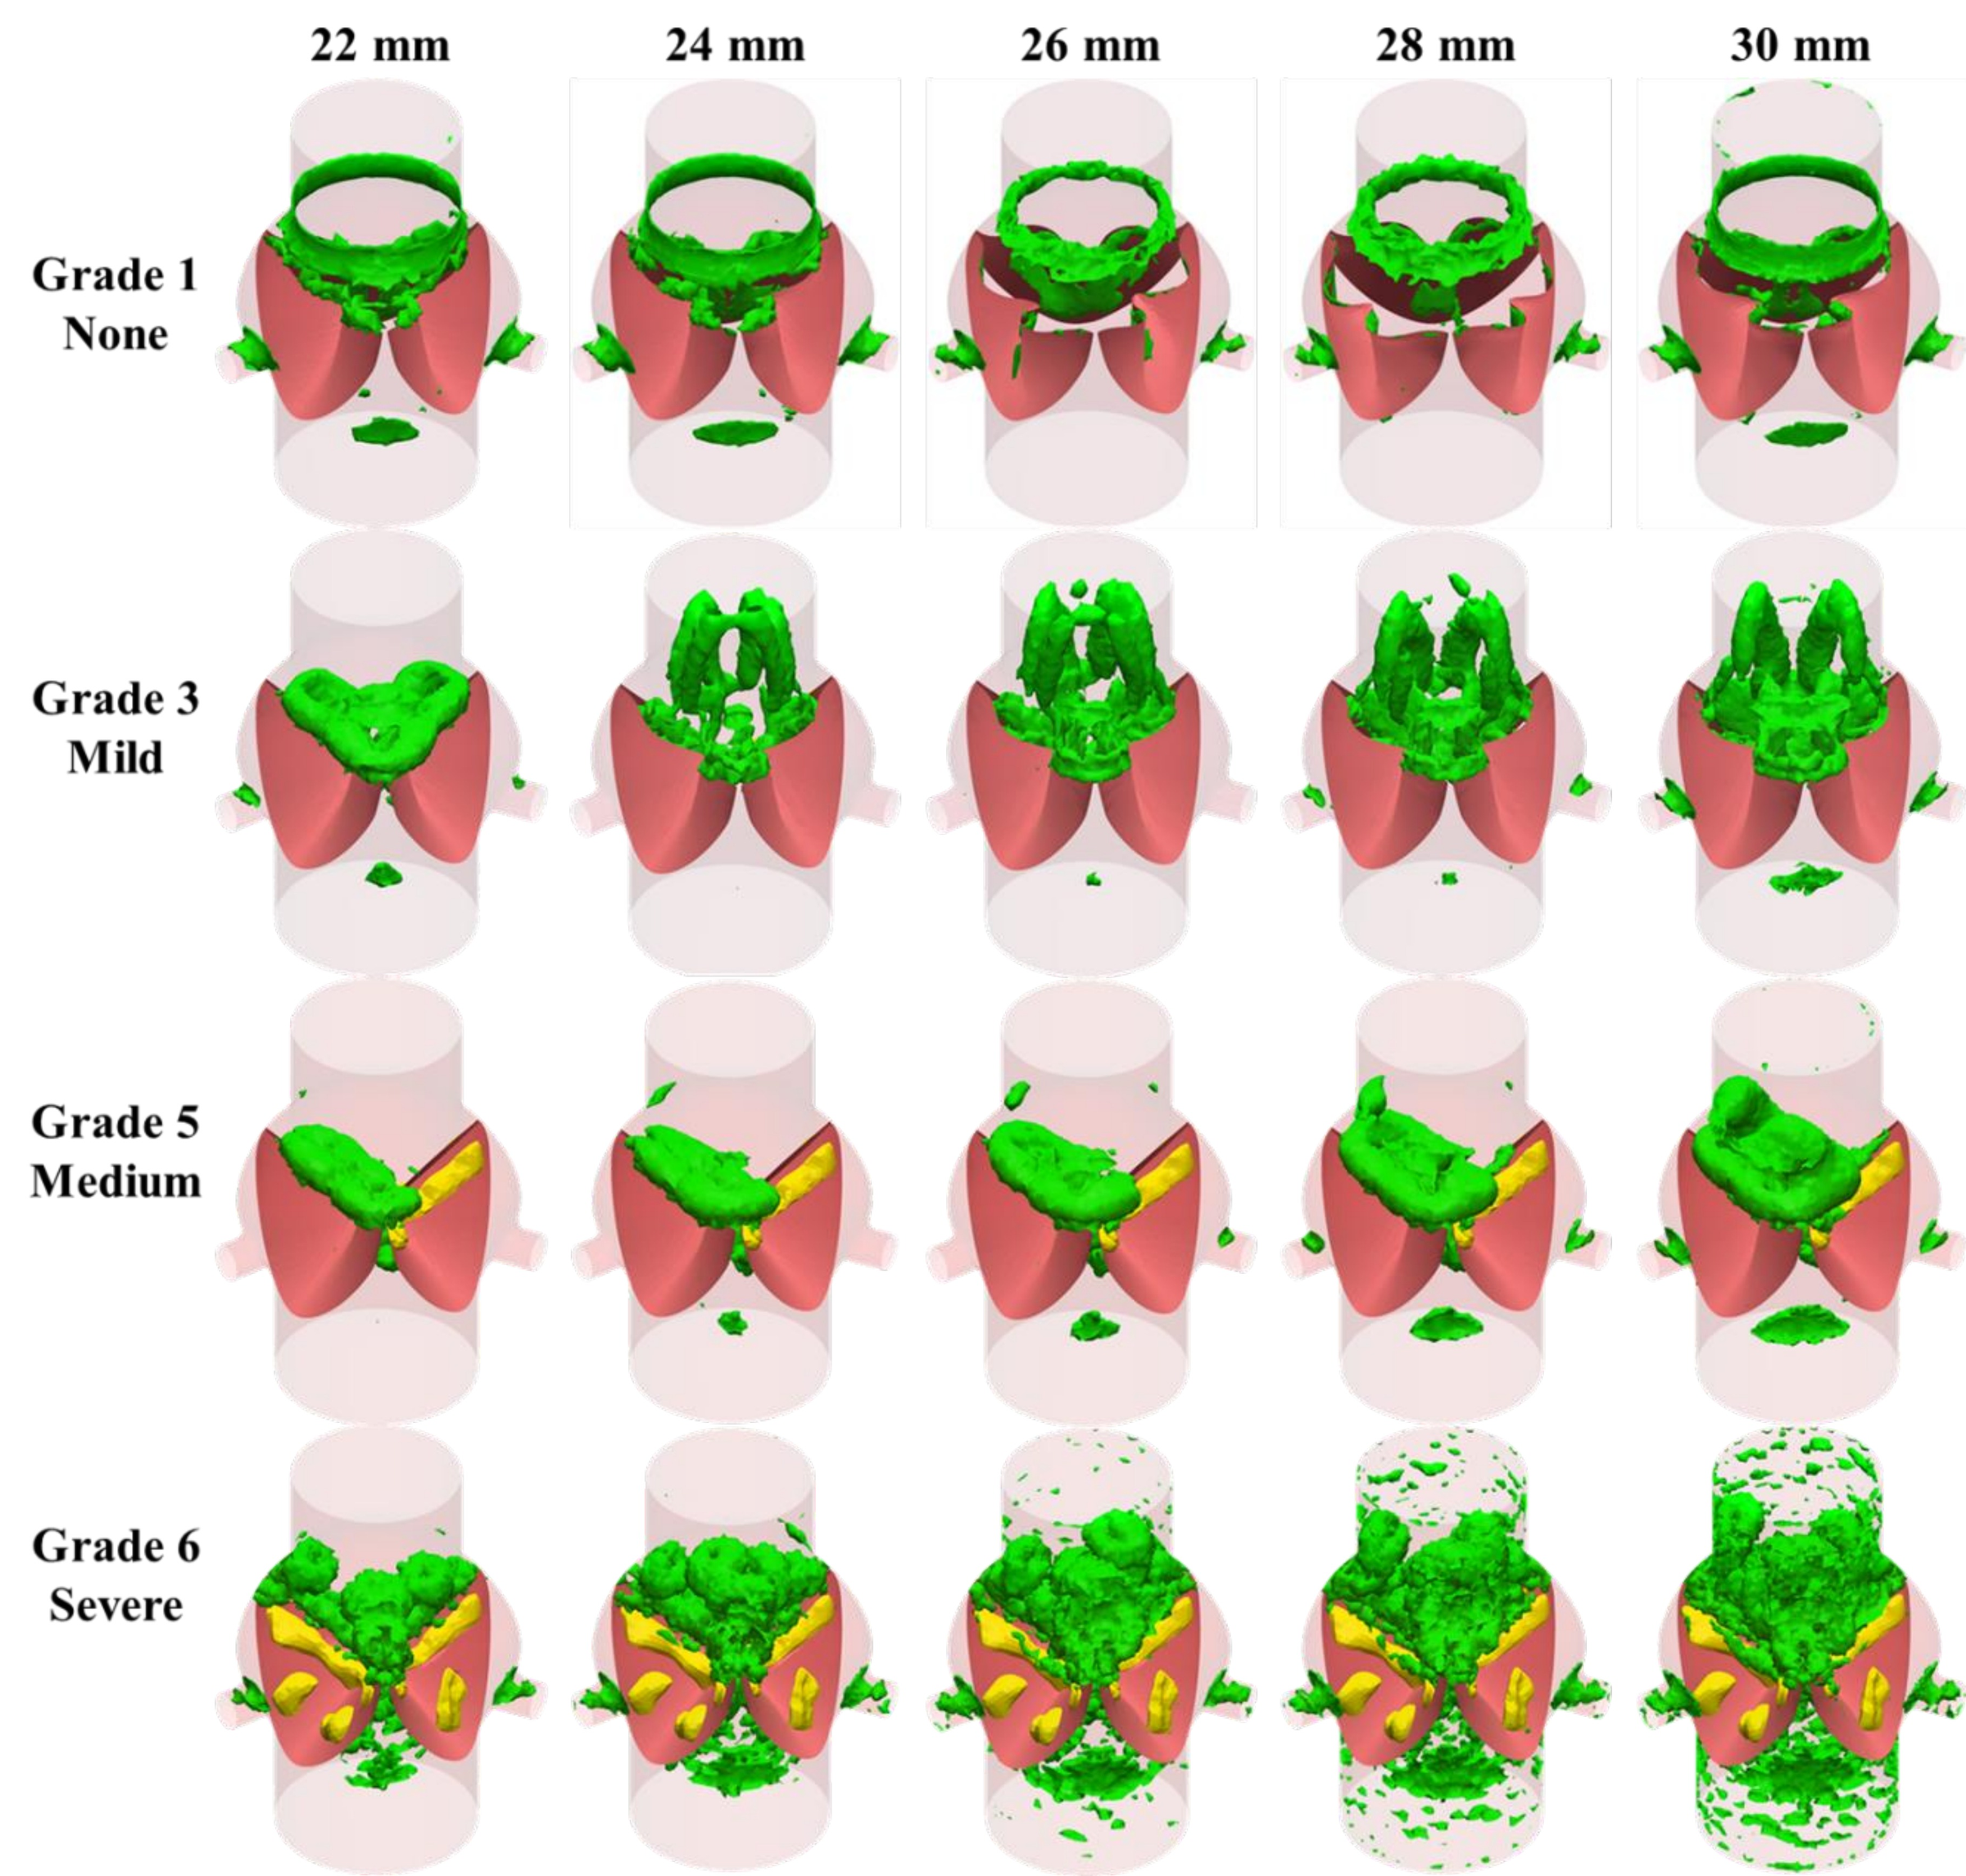
Figure 7-4. Q-criterion vortex formations at peak systole (threshold=10,000 s⁻²). Grade 1 shows a symmetric ring vortex; higher grades produce larger, more disturbed ring structures extending past the sinotubular junction.
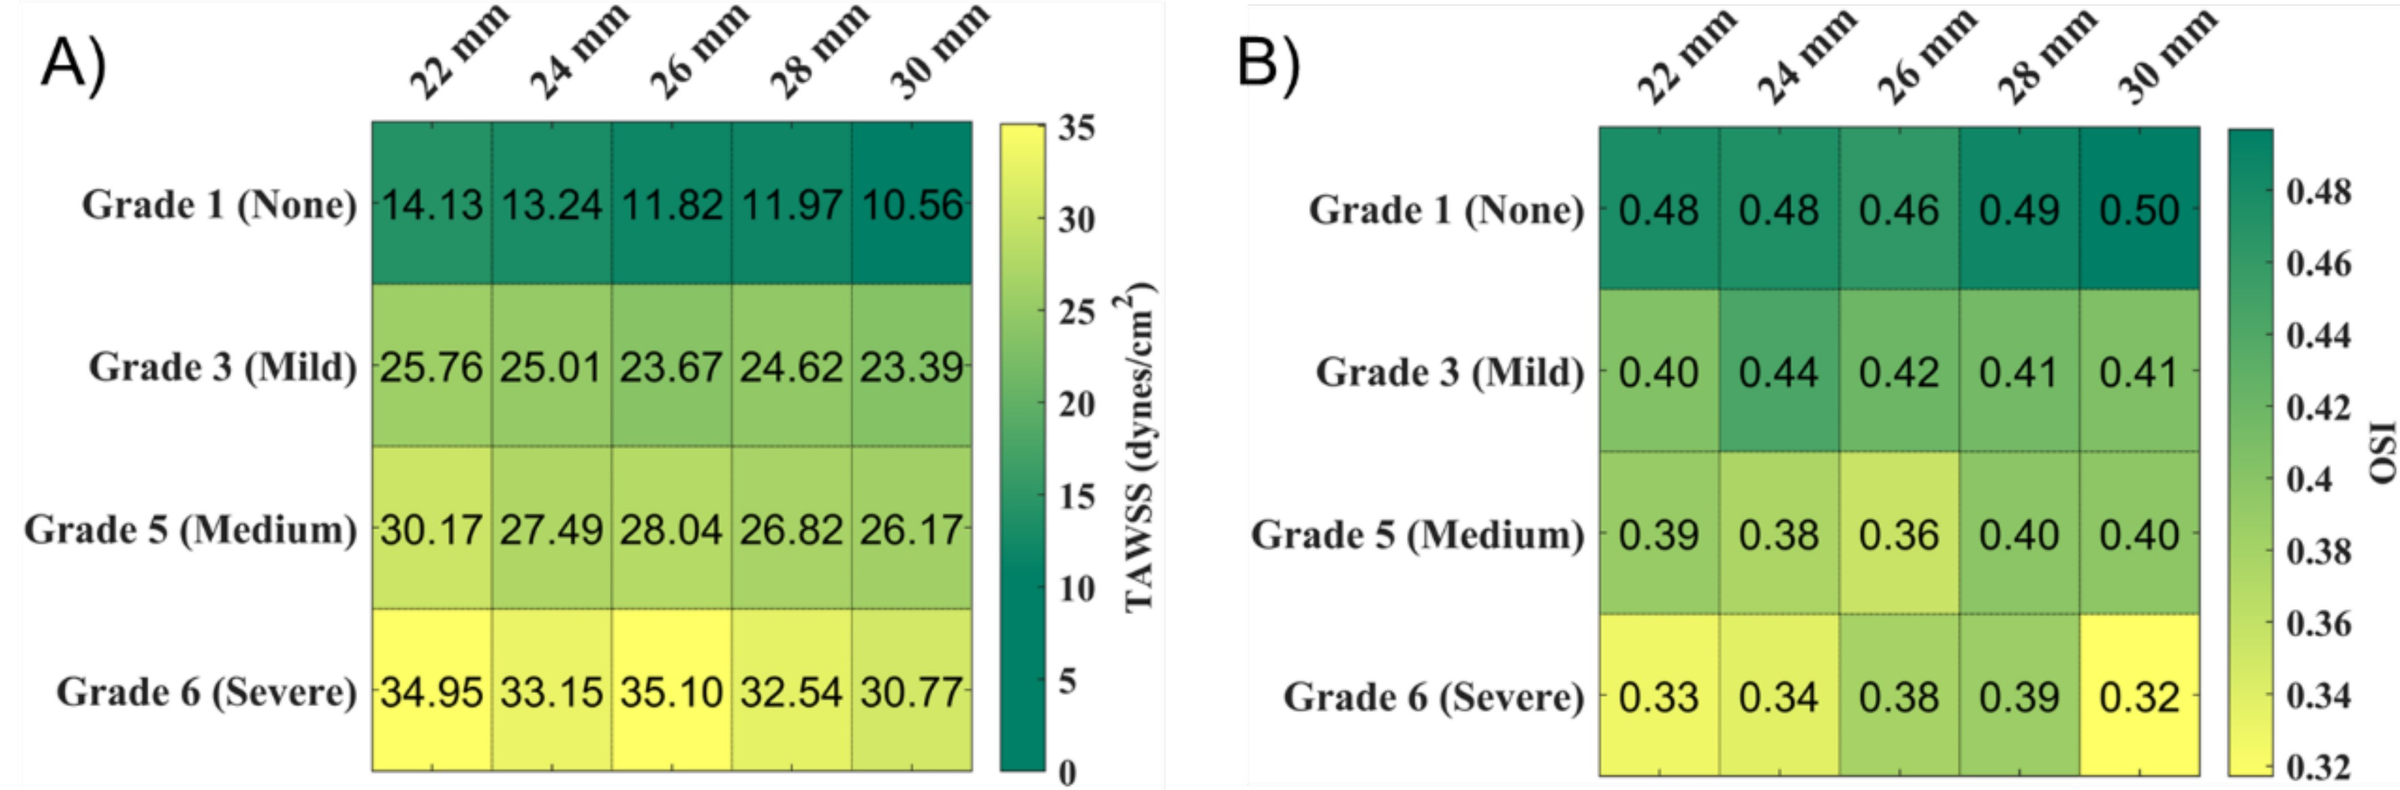
Key Finding — Hemodynamic gradient: TAWSS increased and OSI decreased monotonically with CAVD grade across all valve sizes. These metrics were trackable across the full severity spectrum, from pre-symptomatic (Grade 1–2) to severe (Grade 5–6), providing a computational framework for CAVD staging.
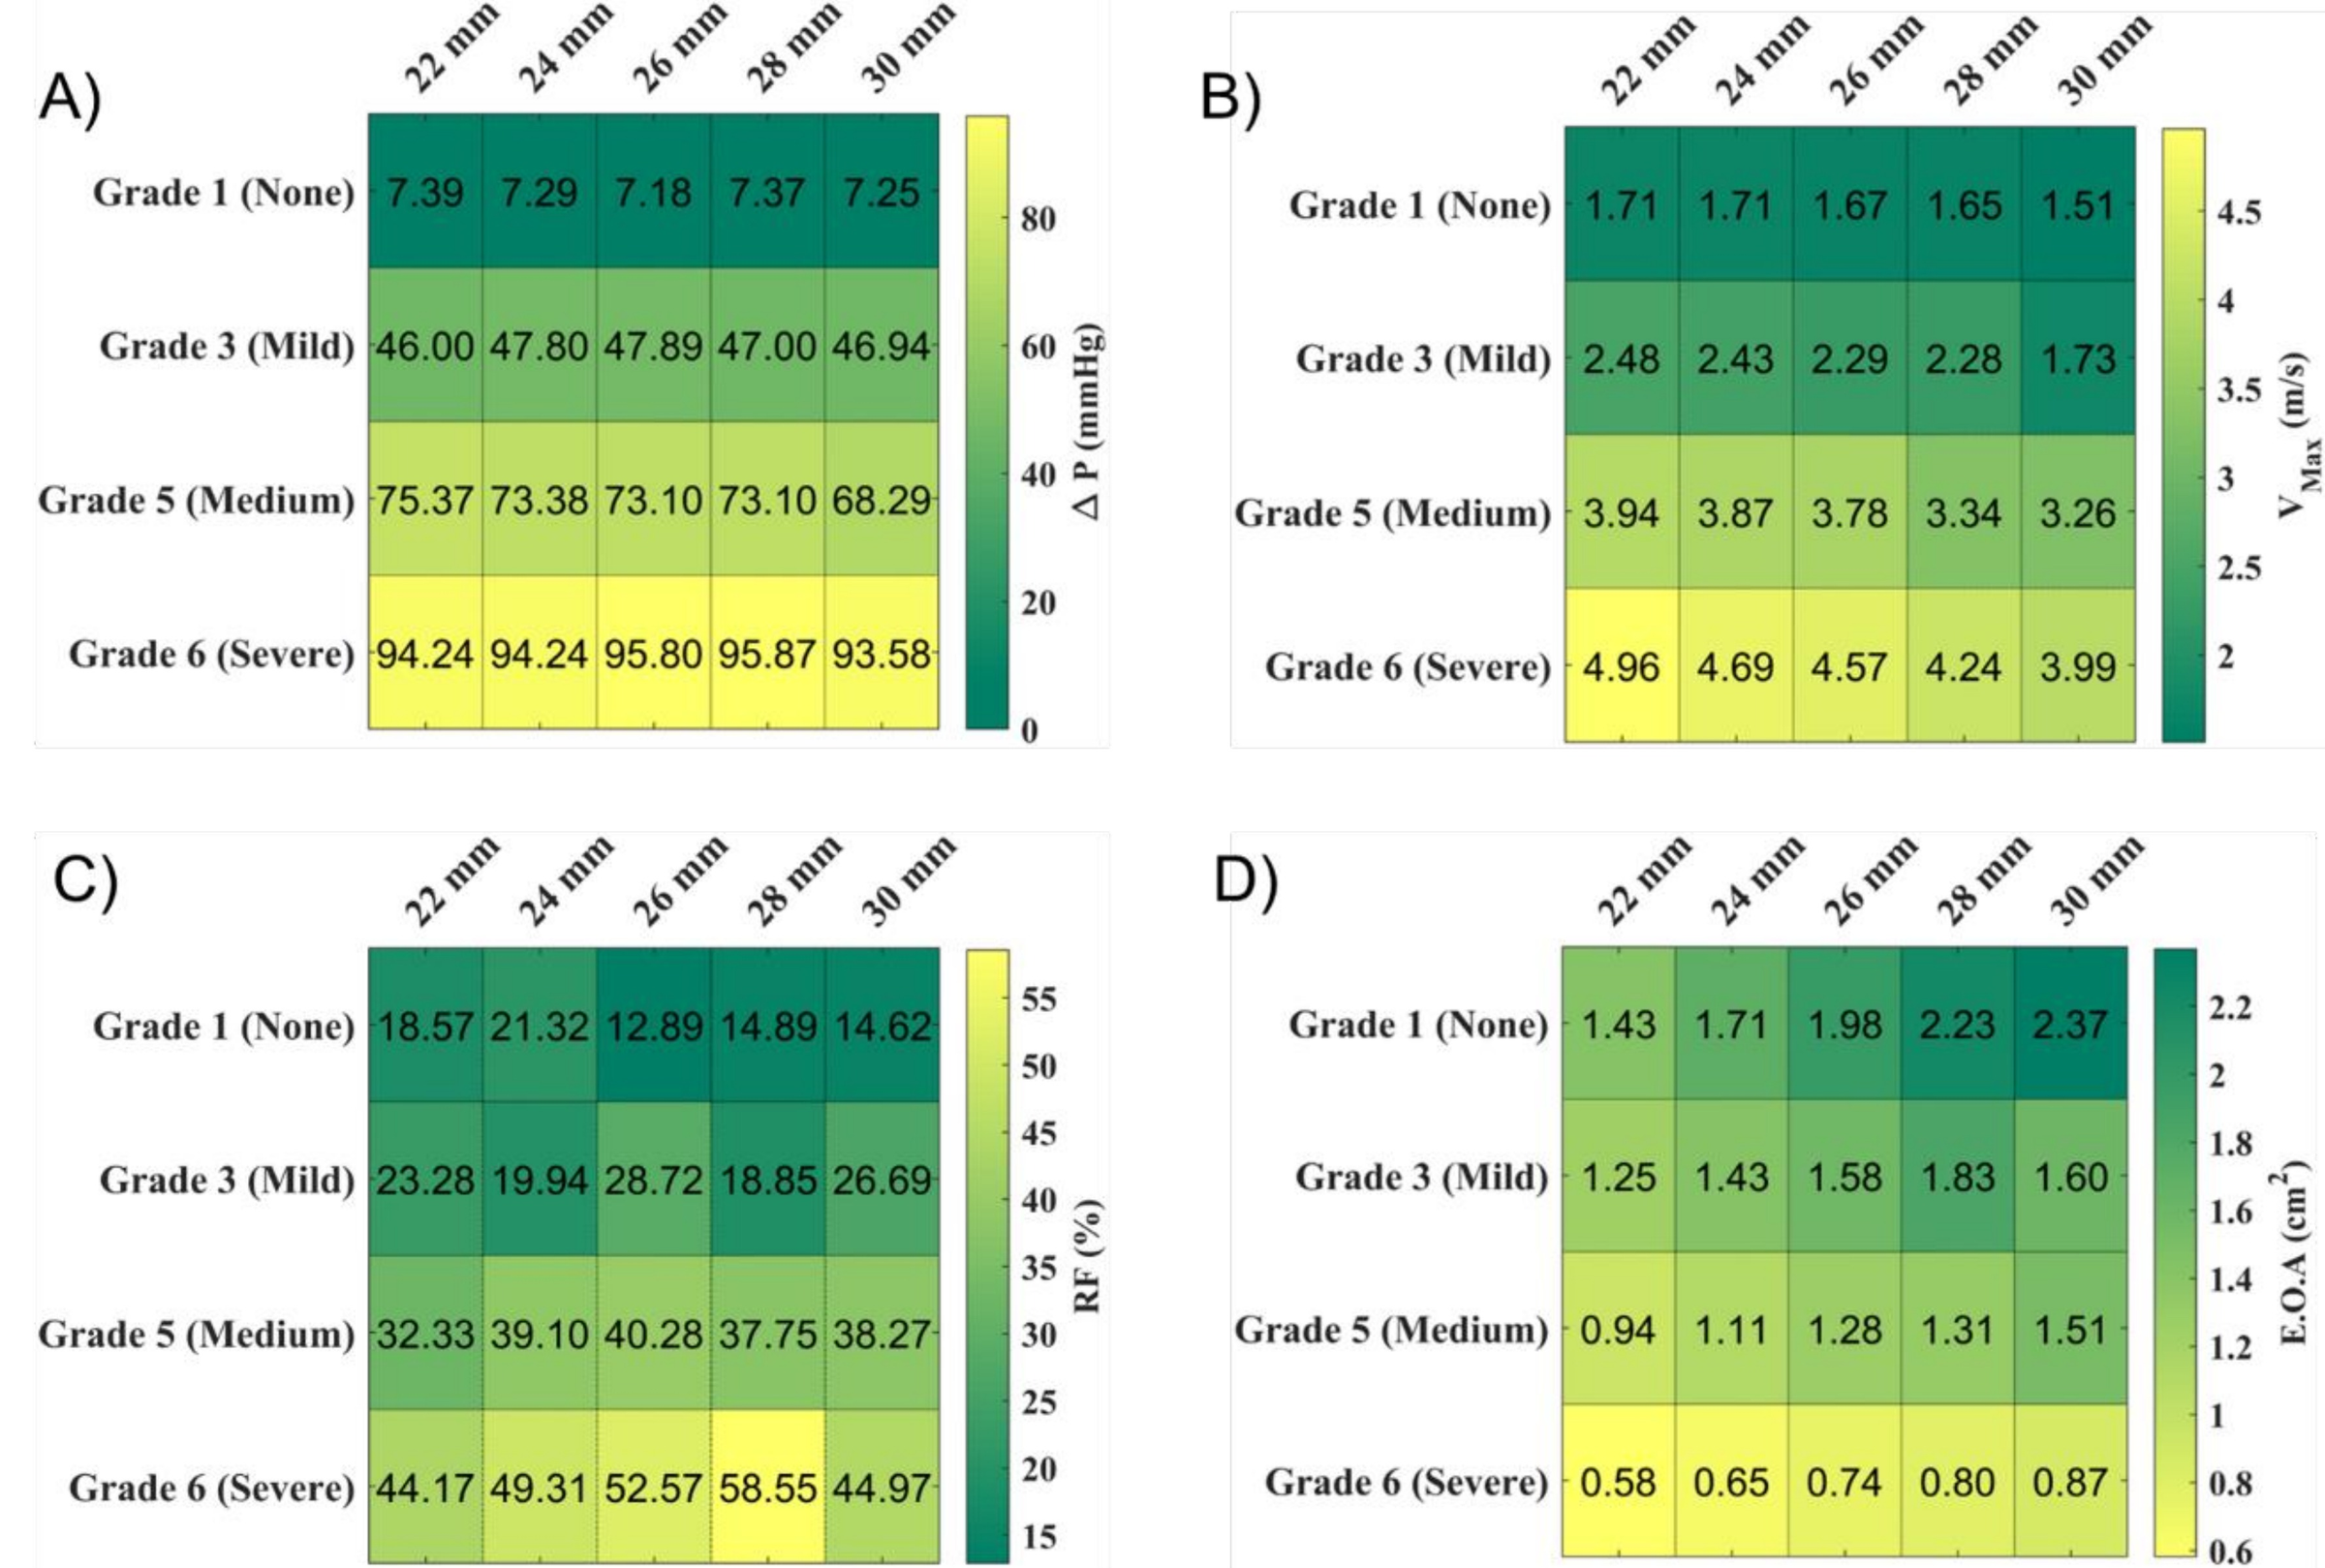
Key Finding — Valve size effect: Larger annular valves showed marginally lower TAWSS and higher OSI than smaller valves at equivalent CAVD grades — suggesting a slight hemodynamic protective effect of larger valve size, possibly related to the larger sinus volume reducing the severity of jet-driven shear concentration. Hydrodynamic metrics (ΔP, Vmax, EOA) were consistent with established echocardiographic thresholds for AS grading.
Key Finding — Flow asymmetry: Grade 3 and Grade 5 valves, where only one or two leaflets are predominantly affected, produced highly asymmetric aortic jets and recirculating turbulent zones — a pattern linked in the literature to aortic dilation morphotypes and elevated aortic wall WSS downstream.
Figure 7-5. Hemodynamic outcome distributions. (A) TAWSS (dynes/cm²) increases with CAVD grade and decreases with valve size. (B) OSI decreases with grade and increases with valve size — together providing a trackable hemodynamic signature of CAVD severity.
Mirza A*, Hsu C-PD, Rodriguez A, Alvarez P, Lou L, Sey M, Agarwal A, Hutcheson JD*, Ramaswamy S. Computational Model for Early-Stage Aortic Valve Calcification Shows Hemodynamic Biomarkers.
The dissertation draws on fluid mechanics, structural mechanics, and hemodynamic analysis. The central equations spanning all four research aims are compiled here.
where $\mu(\dot{\gamma})$ is the fluid dynamic viscosity (possibly shear-rate dependent), $\overrightarrow{u_f}$ is the fluid velocity vector, and $y$ is the wall-normal coordinate.
Averaged over one cardiac cycle of period $T$. Elevated TAWSS correlates with the onset of calcific deposit formation and is the primary hemodynamic biomarker proposed in this dissertation.
OSI ranges from 0 (purely unidirectional flow) to 0.5 (fully oscillatory, zero net direction). High OSI at the leaflet fibrosa is associated with endothelial dysfunction and early-stage calcification.
Arbitrary Lagrangian-Eulerian (ALE) form used in FSI simulations. $m_f$ is the mesh velocity; the ALE term $(\overrightarrow{u_f} - m_f)$ accounts for mesh motion relative to the fluid material.
Three-parameter incompressible hyperelastic model for aortic leaflets. $\bar{I}_1, \bar{I}_2$ are the principal invariants of the Cauchy-Green deformation tensor. Fitted values: $C_{10} = 32.823$ kPa, $C_{01} = 2.955$ kPa, $C_{11} = 585.79$ kPa.
First-order Ogden model used for porcine-equivalent aortic leaflets. $\lambda_i$ are principal stretches; $\mu = 75.310$ kPa, $\alpha = 12.275$, Poisson's ratio = 0.495.
Surface-integrated metrics used to compare cusp-level hemodynamics as right coronary ostium height varies. A drop in ASR and AWSS on the RCC as $h_{\text{RightCO}}$ increases past the coaptation height explains the reversed calcification pattern.
CH. 8
Overall Conclusions & Future Directions
Synthesis
This dissertation establishes the computational and experimental foundation for TAWSS and OSI as pre-symptomatic hemodynamic biomarkers of CAVD — measurable through FSI simulation before conventional clinical parameters detect any disease.
The four-chapter research arc demonstrates: (1) the viscosity model matters in severe CAVD — non-Newtonian modeling is required for accurate WSS prediction; (2) TAWSS and OSI detect early-stage CAVD when hydrodynamics cannot; (3) coronary ostium geometry explains the paradoxical mouse calcification pattern; and (4) a scalable parametric pipeline quantifies hemodynamic biomarker signatures across the full clinical spectrum of valve sizes and disease severities.
Immediate Next Step
Validate the parametric FSI model against pre- and post-TAVR MRI/CT data from at least 3 patients per valve size category (22–30 mm) across CAVD grades — correlating computational TAWSS/OSI with physician calcium scoring and post-operative hemodynamics.
Clinical Translation
Develop a patient-specific CAVD tracking pipeline: CT/MRI → parametrized valve reconstruction → FSI simulation → TAWSS/OSI biomarker extraction → longitudinal disease trajectory prediction. Target: identify candidates for early intervention before symptomatic threshold.
Therapeutic Development
The computational framework provides a testbed for evaluating proposed pharmacological treatments for CAVD. By simulating early-stage disease under intervention (lipid-lowering, anti-calcification agents), the pipeline could predict hemodynamic response before costly in vivo trials.
The work presented here represents the first systematic computational demonstration that hemodynamic biomarkers can delineate CAVD severity across the clinical spectrum of valve sizes — providing a theoretical framework for pre-symptomatic CAVD detection and a scalable tool for population-level hemodynamic modeling of aortic valve disease.
PhD Dissertation · Asad Mirza · FIU Biomedical Engineering · Defended June 26, 2024 ·
Advisor: Dr. Sharan Ramaswamy